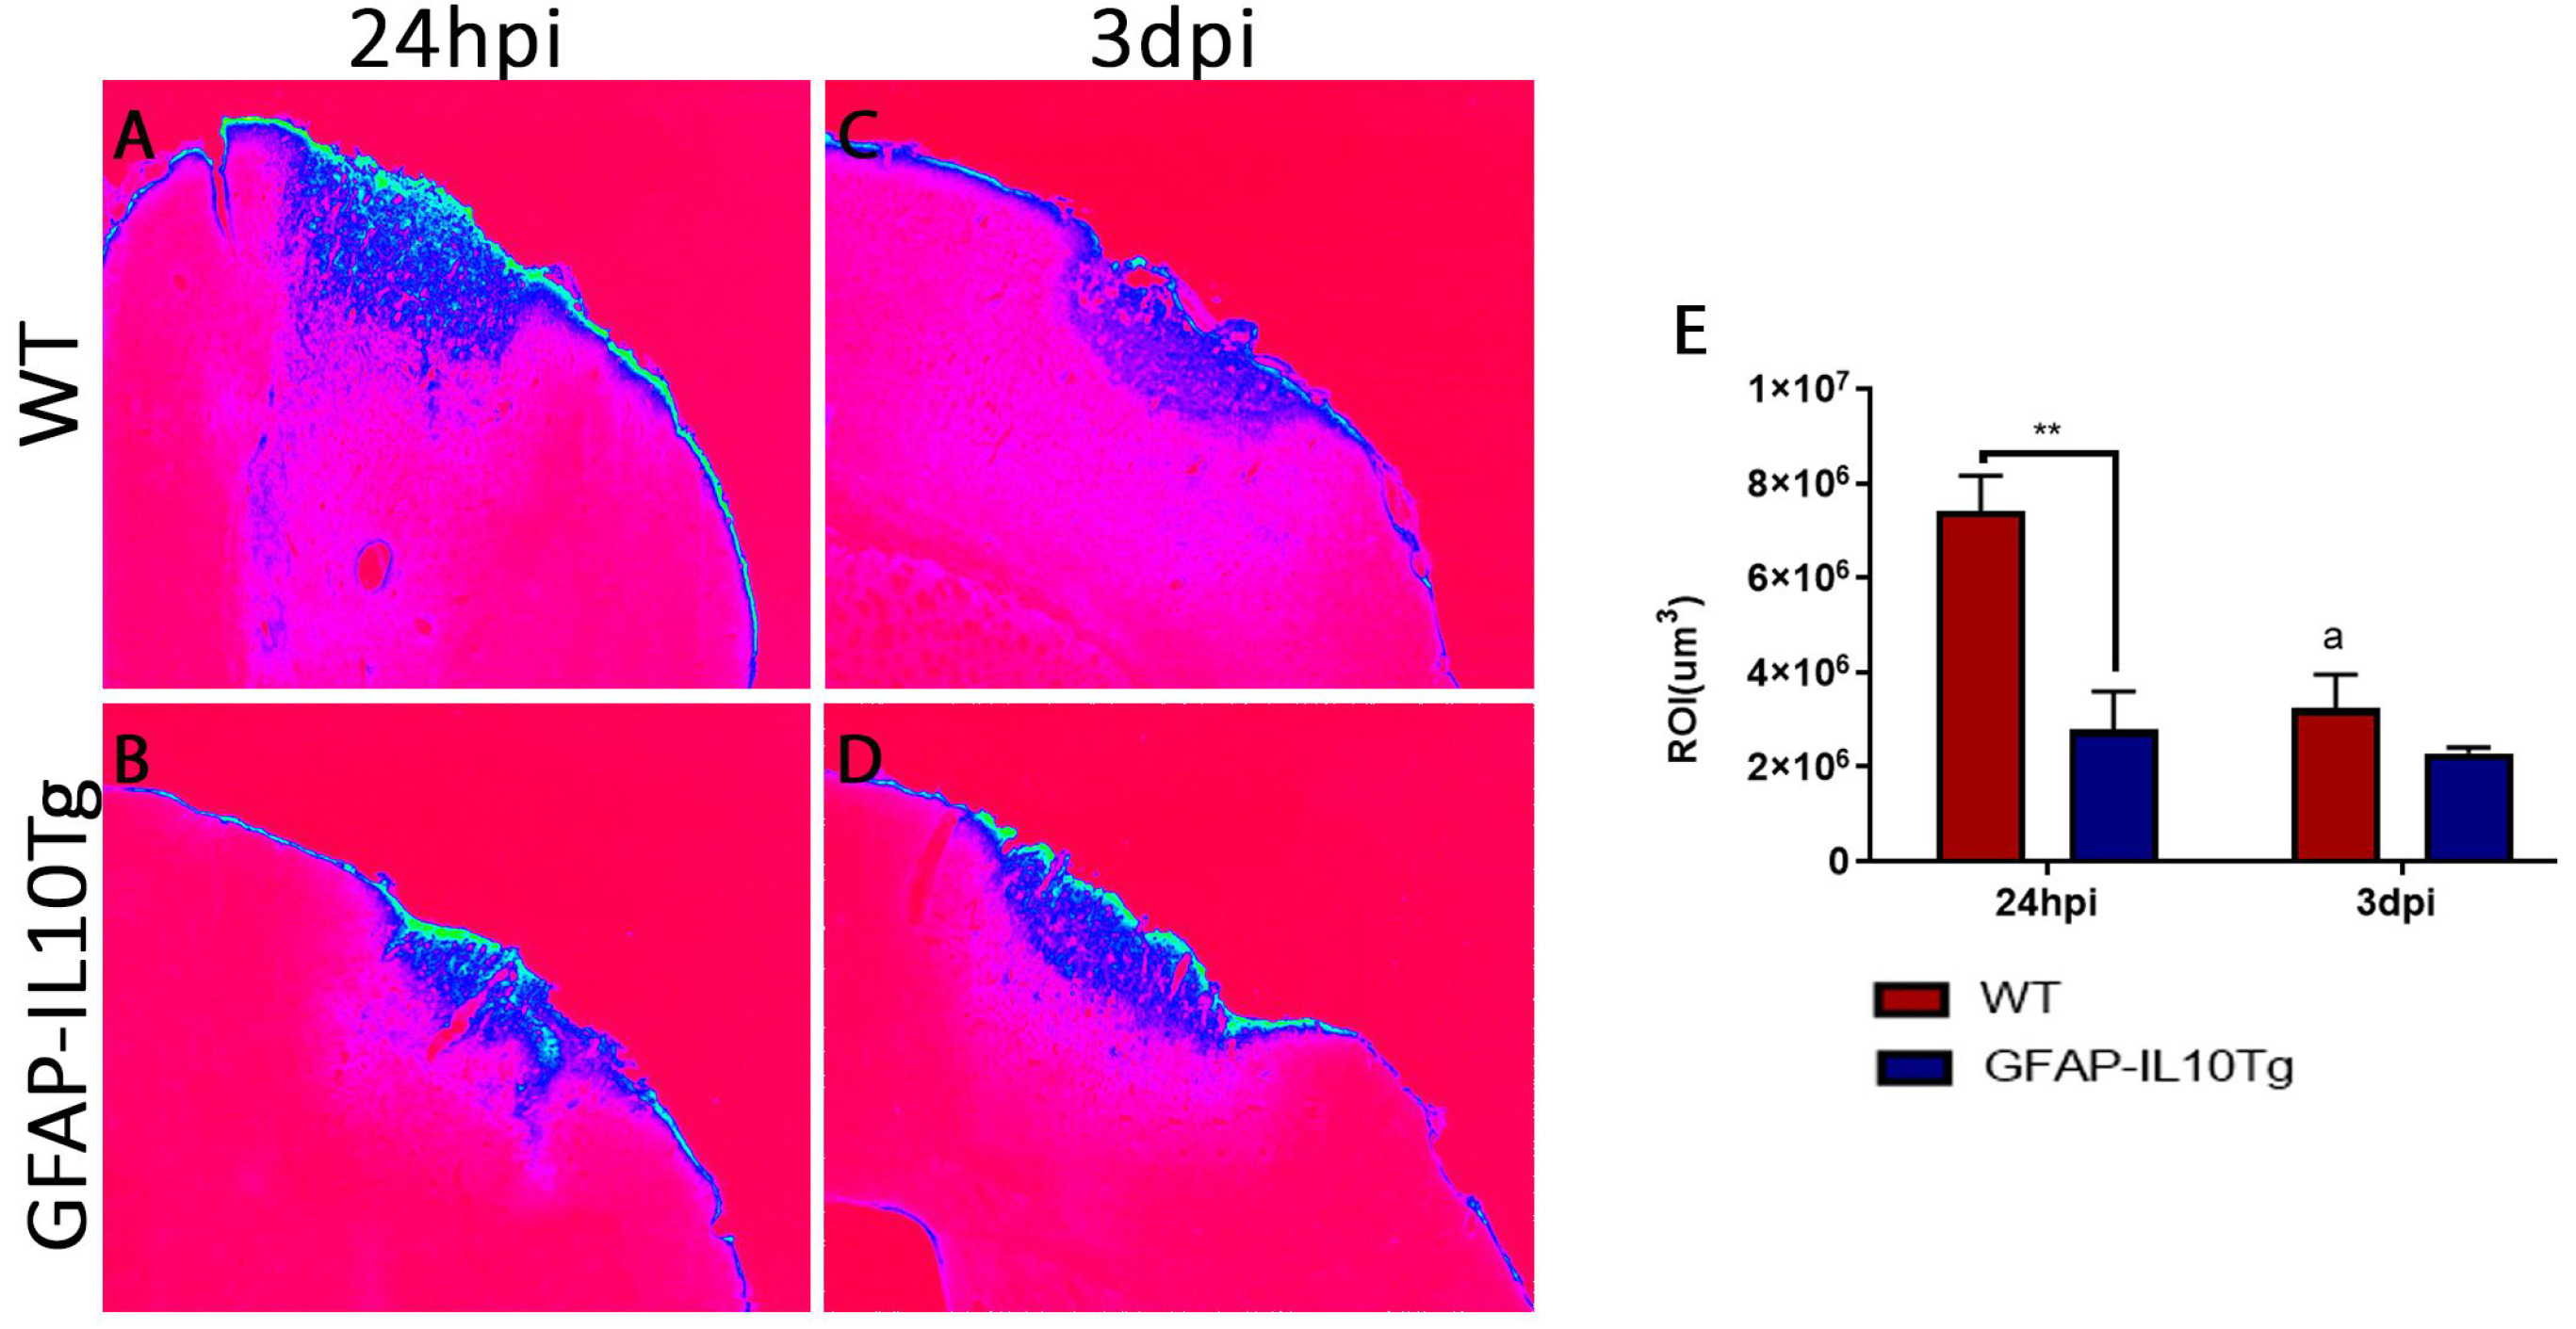
Fig. 10. IgG immunohistochemistry. (A~D) Representative images showing IgG immunostaining (pseudo-color technique modified by LUT filter in Image J software) representing BBB leakage in WT (A, C) and GFAP-IL10Tg animals (B, D) at 24 hpi and 3 dpi. Blue staining represented IgG staining, whereas a red color represented a non-stained area. (E) Graph showing the quantification of volume (ROI) occupied by the IgG staining in WT and GFAP-IL10Tg animals at 24 hpi and 3 dpi. Note that transgenic animals presented a significantly lower lgG extravasation, in comparison to WT at 24 hpi. All values are represented as mean±SEM (**p≤0.01). In WT animals, “a” indicates significant vs 24 hpi.
© Exp Neurobiol