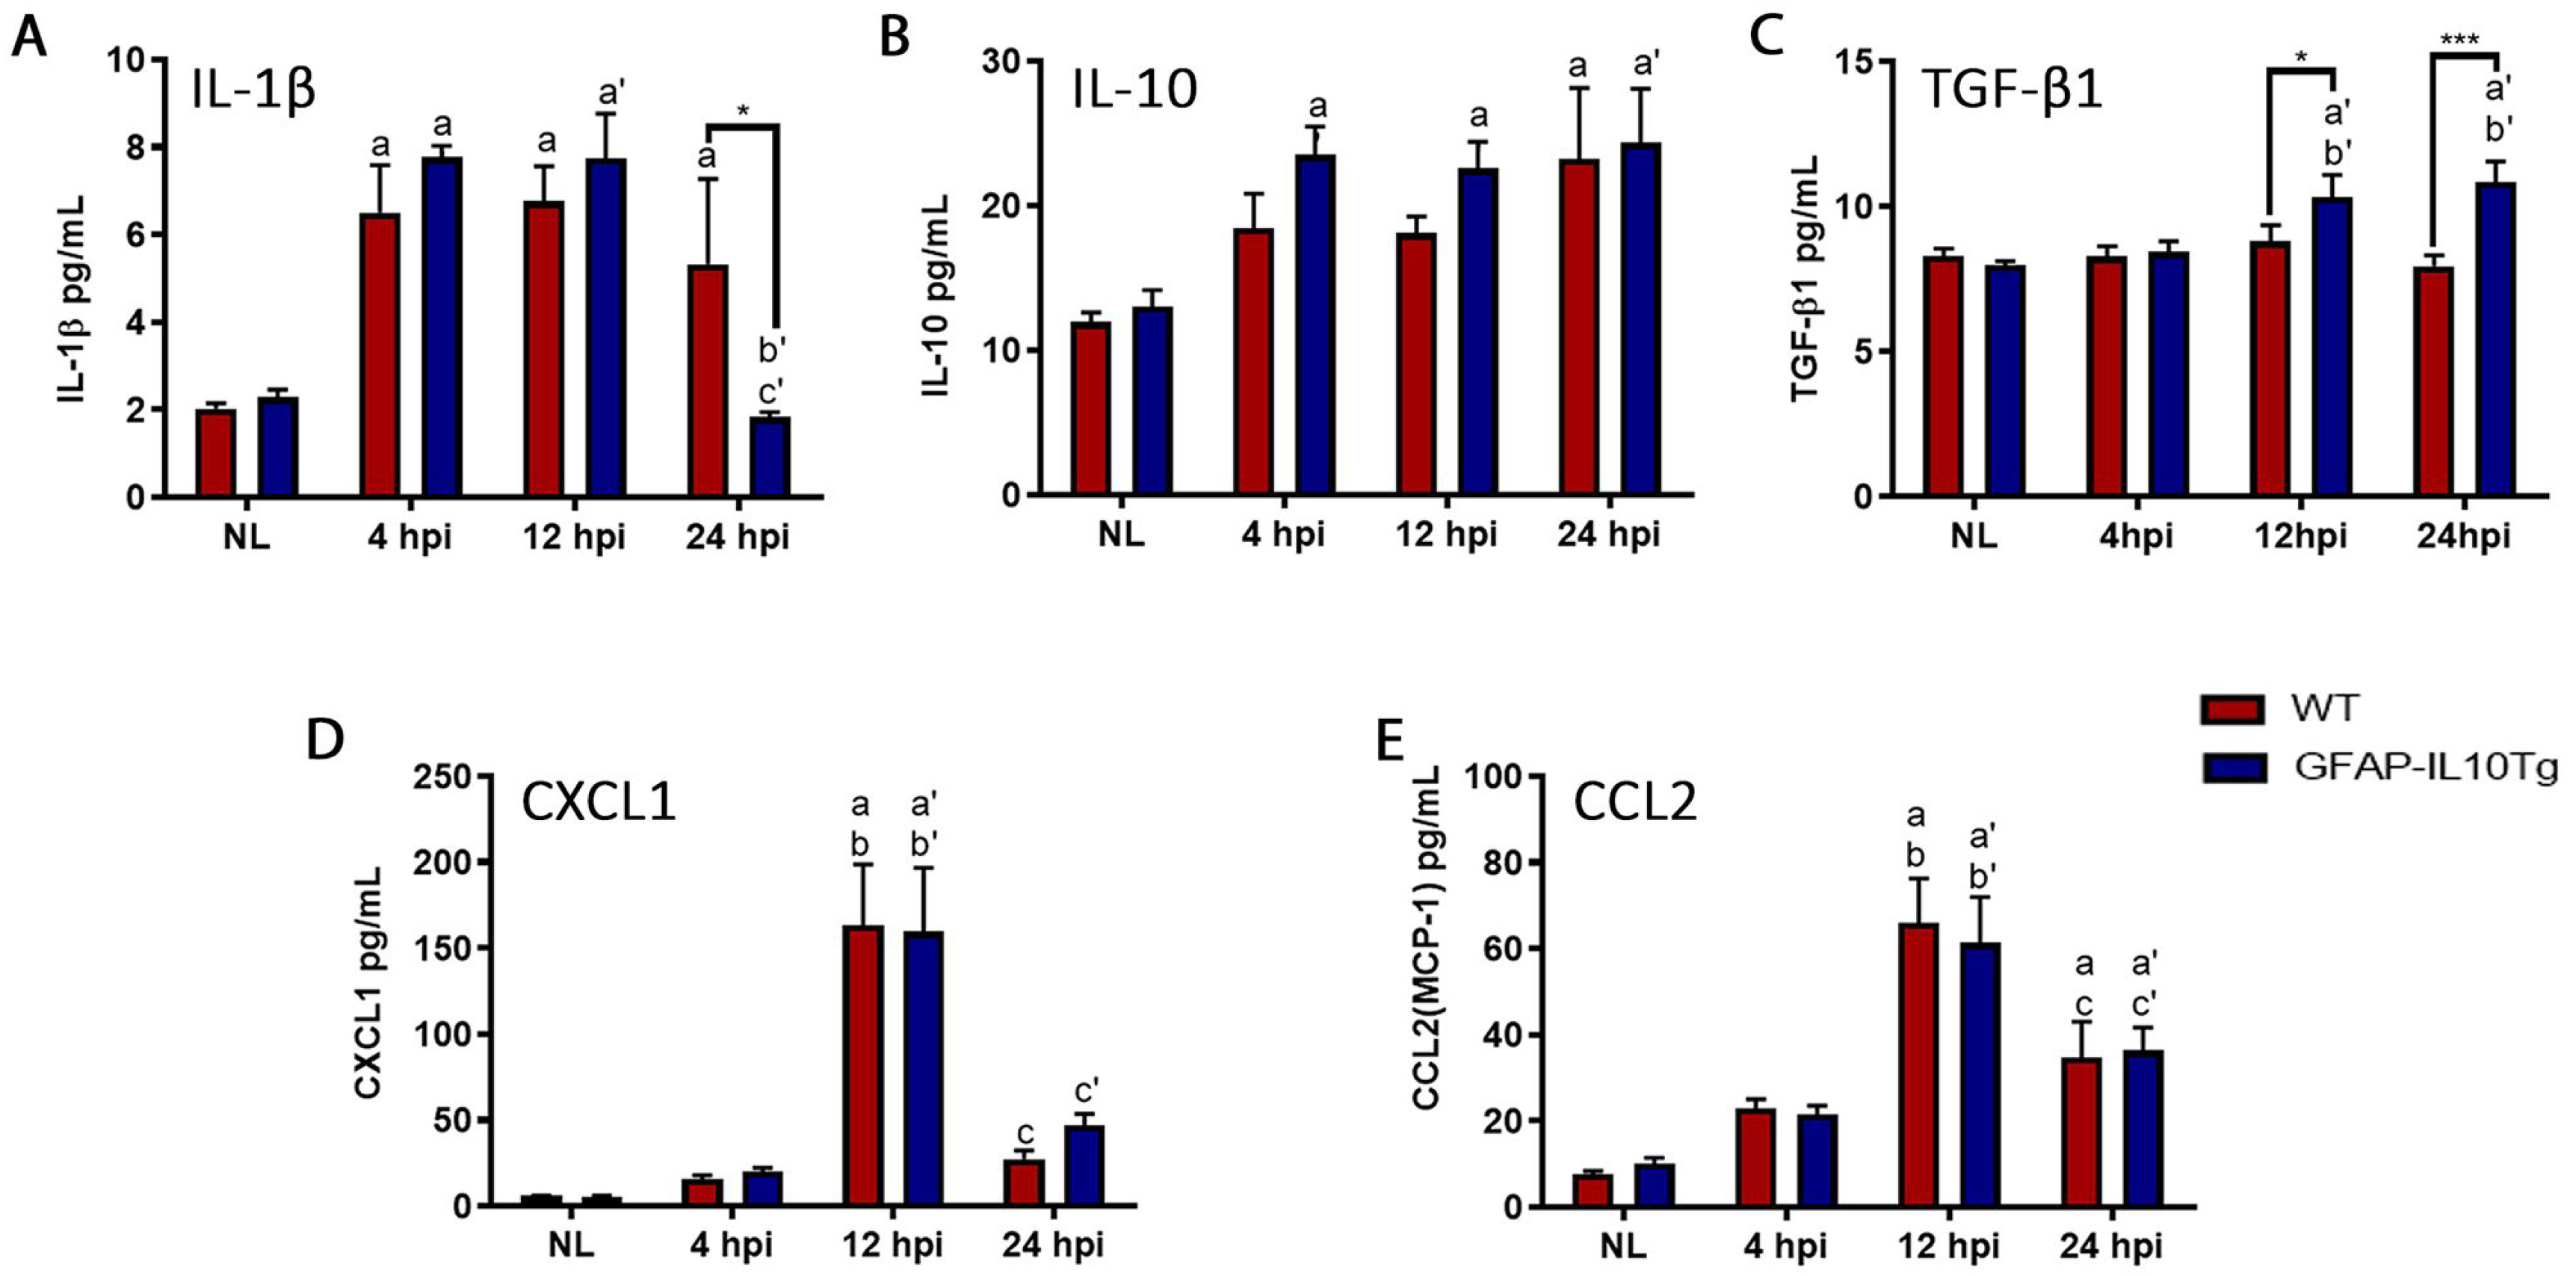
Fig. 11. Cytokine/chemokine expression. Graphs showing the temporal expression of IL-1β (A), IL-10 (B), TGF-β1 (C), CXCL1 (D) and CCL2 (E) in non-lesioned (NL) and TBI-lesioned animals from 4 hpi to 24 hpi in both WT and GFAP-IL10Tg animals. Note the lower levels of IL-1β and the higher levels of TGF-β1 observed in GFAP-IL10Tg mice at 12 hpi and 24 hpi. All values are represented as mean±SEM (*p≤0.05, ***p≤0.001). In WT animals: “a” indicates significant vs NL, “b” indicates significant vs 4 hpi, “c” indicates significant vs 12 hpi. In GFAP-IL10Tg animals: “a’” indicates significant vs NL, “b’” indicates significant vs 4 hpi, “c’” indicates significant vs 12 hpi.
© Exp Neurobiol