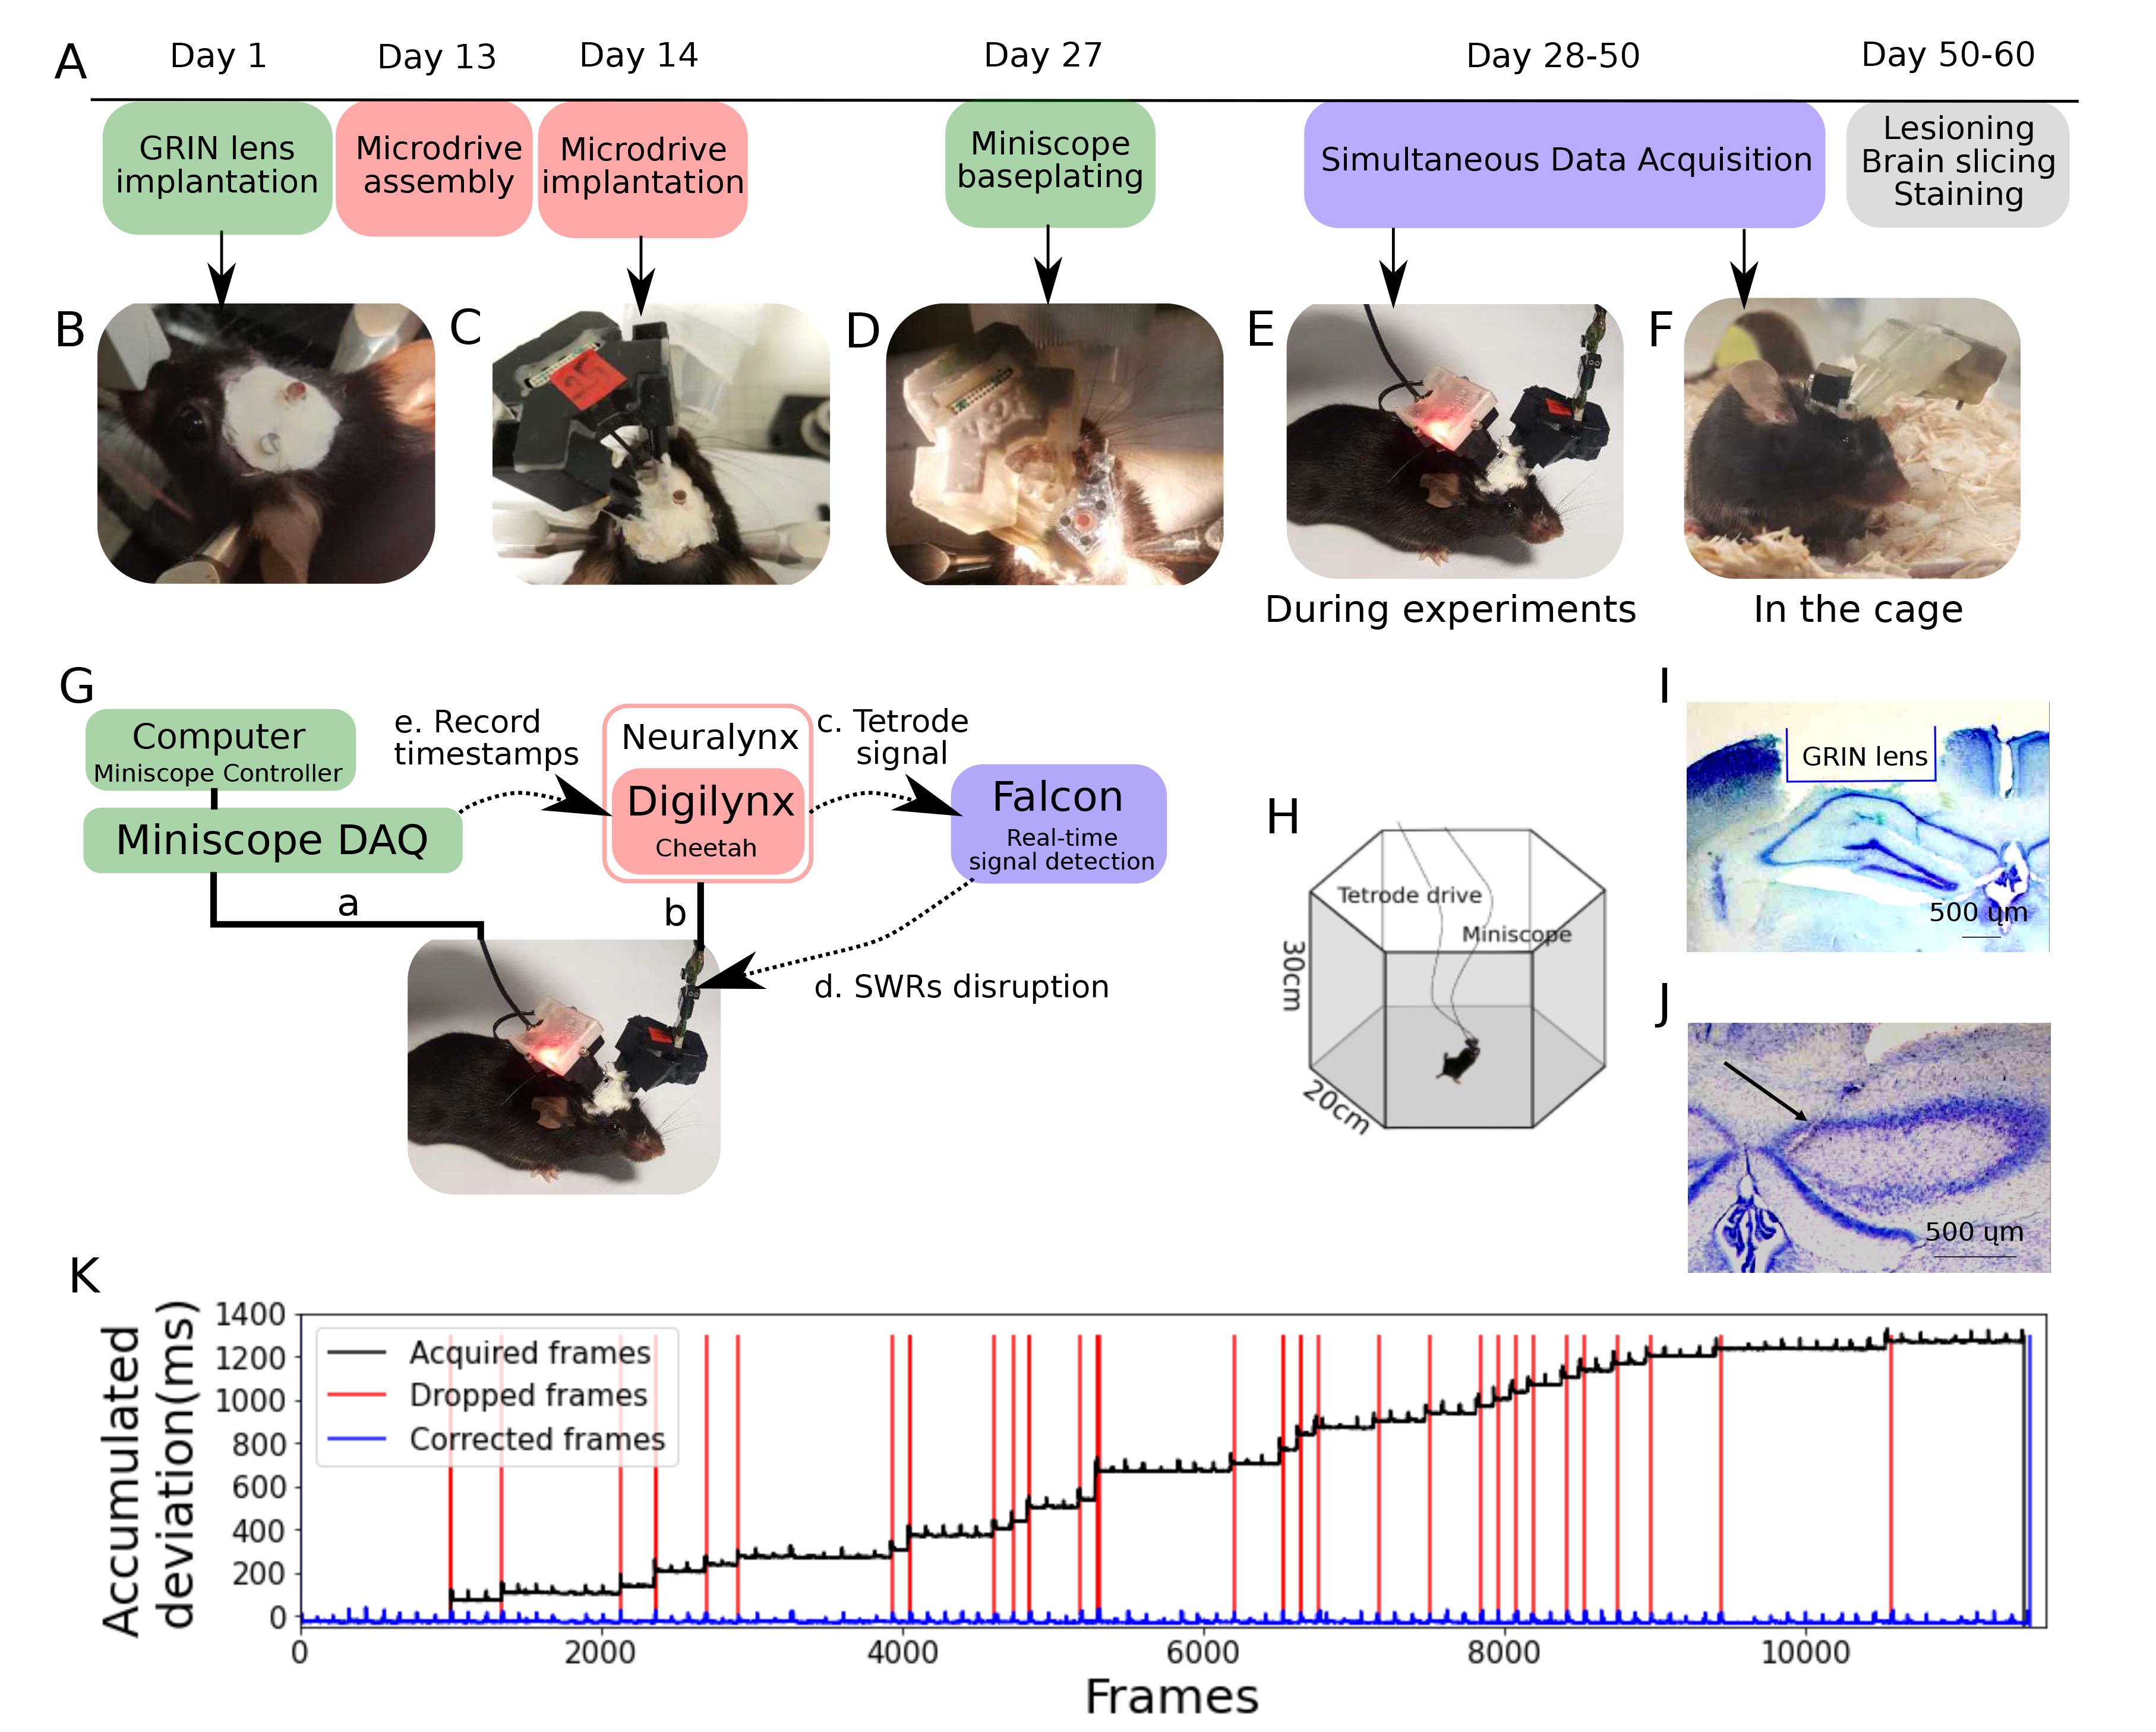
Fig. 3. Experimental timeline and recording system. (A) Experimental timeline. Single-photon calcium imaging: GRIN lens was implanted on the surface of the hippocampal CA1 of the right hemisphere (Day 1), and blood clearance at the surgical site was confirmed 2~3 weeks after the implantation (B). When calcium activity was observed through the implanted lens, mice were equipped with a baseplate (Day 27) to mount the miniscope (D). Once microdrive implantation was consolidated, miniscope was mounted on the baseplate and data acquisition was performed simultaneously with the LFP recording (Day 28~50) (E). Electrophysiological recording: Microdrive array manufacturing takes 1 day (8 hours, Day 13). Assembled microdrive array was carefully implanted above the target brain regions (Day 14) (C). After implantation, animals underwent 5~7 days of post-operative recovery. After recovery, electrophysiological signals were acquired, together with the calcium signal (Day 28~50) (E). In the home cage animals only carried the microdrive array, but not the miniscope, which was mounted onto the baseplate just prior to the start of the recording session. After experiments were completed, the implantation sites for the GRIN lens and tetrodes were validated histologically (Day 50~60) (F). (G) Set up of the acquisition system for simultaneous imaging, electrical recording, and closed-loop stimulation. 1-photon calcium signal was acquired by miniscope connected to a dedicated computer using Miniscope Controller software (a). Electrical signals were acquired with a Digilynx acquisition system and stored on a computer running Cheetah software (b). The digitized electrical signals were also streamed to a separate computer running Falcon software for real-time hippocampal ripple detection (c) and closed-loop feedback stimulation in the VHC (d). Each video frame from the miniscope was timestamped in the Digilynx system for synchronization with the electrical signals (e). (H) Recording chamber. (I) Coronal section of the dorsal hippocampus showing the location of the implanted GRIN lens. (J) Coronal section of the dorsal hippocampus showing a tetrode track. The arrow indicates the lesion made by an electrical current applied to the tetrode to verify the recording location. (K) Accumulated time deviation between acquired frames and theoretically generated frames of calcium imaging (Black: acquired frames, Red: timepoint of dropped frames, Blue: Corrected frames).
© Exp Neurobiol