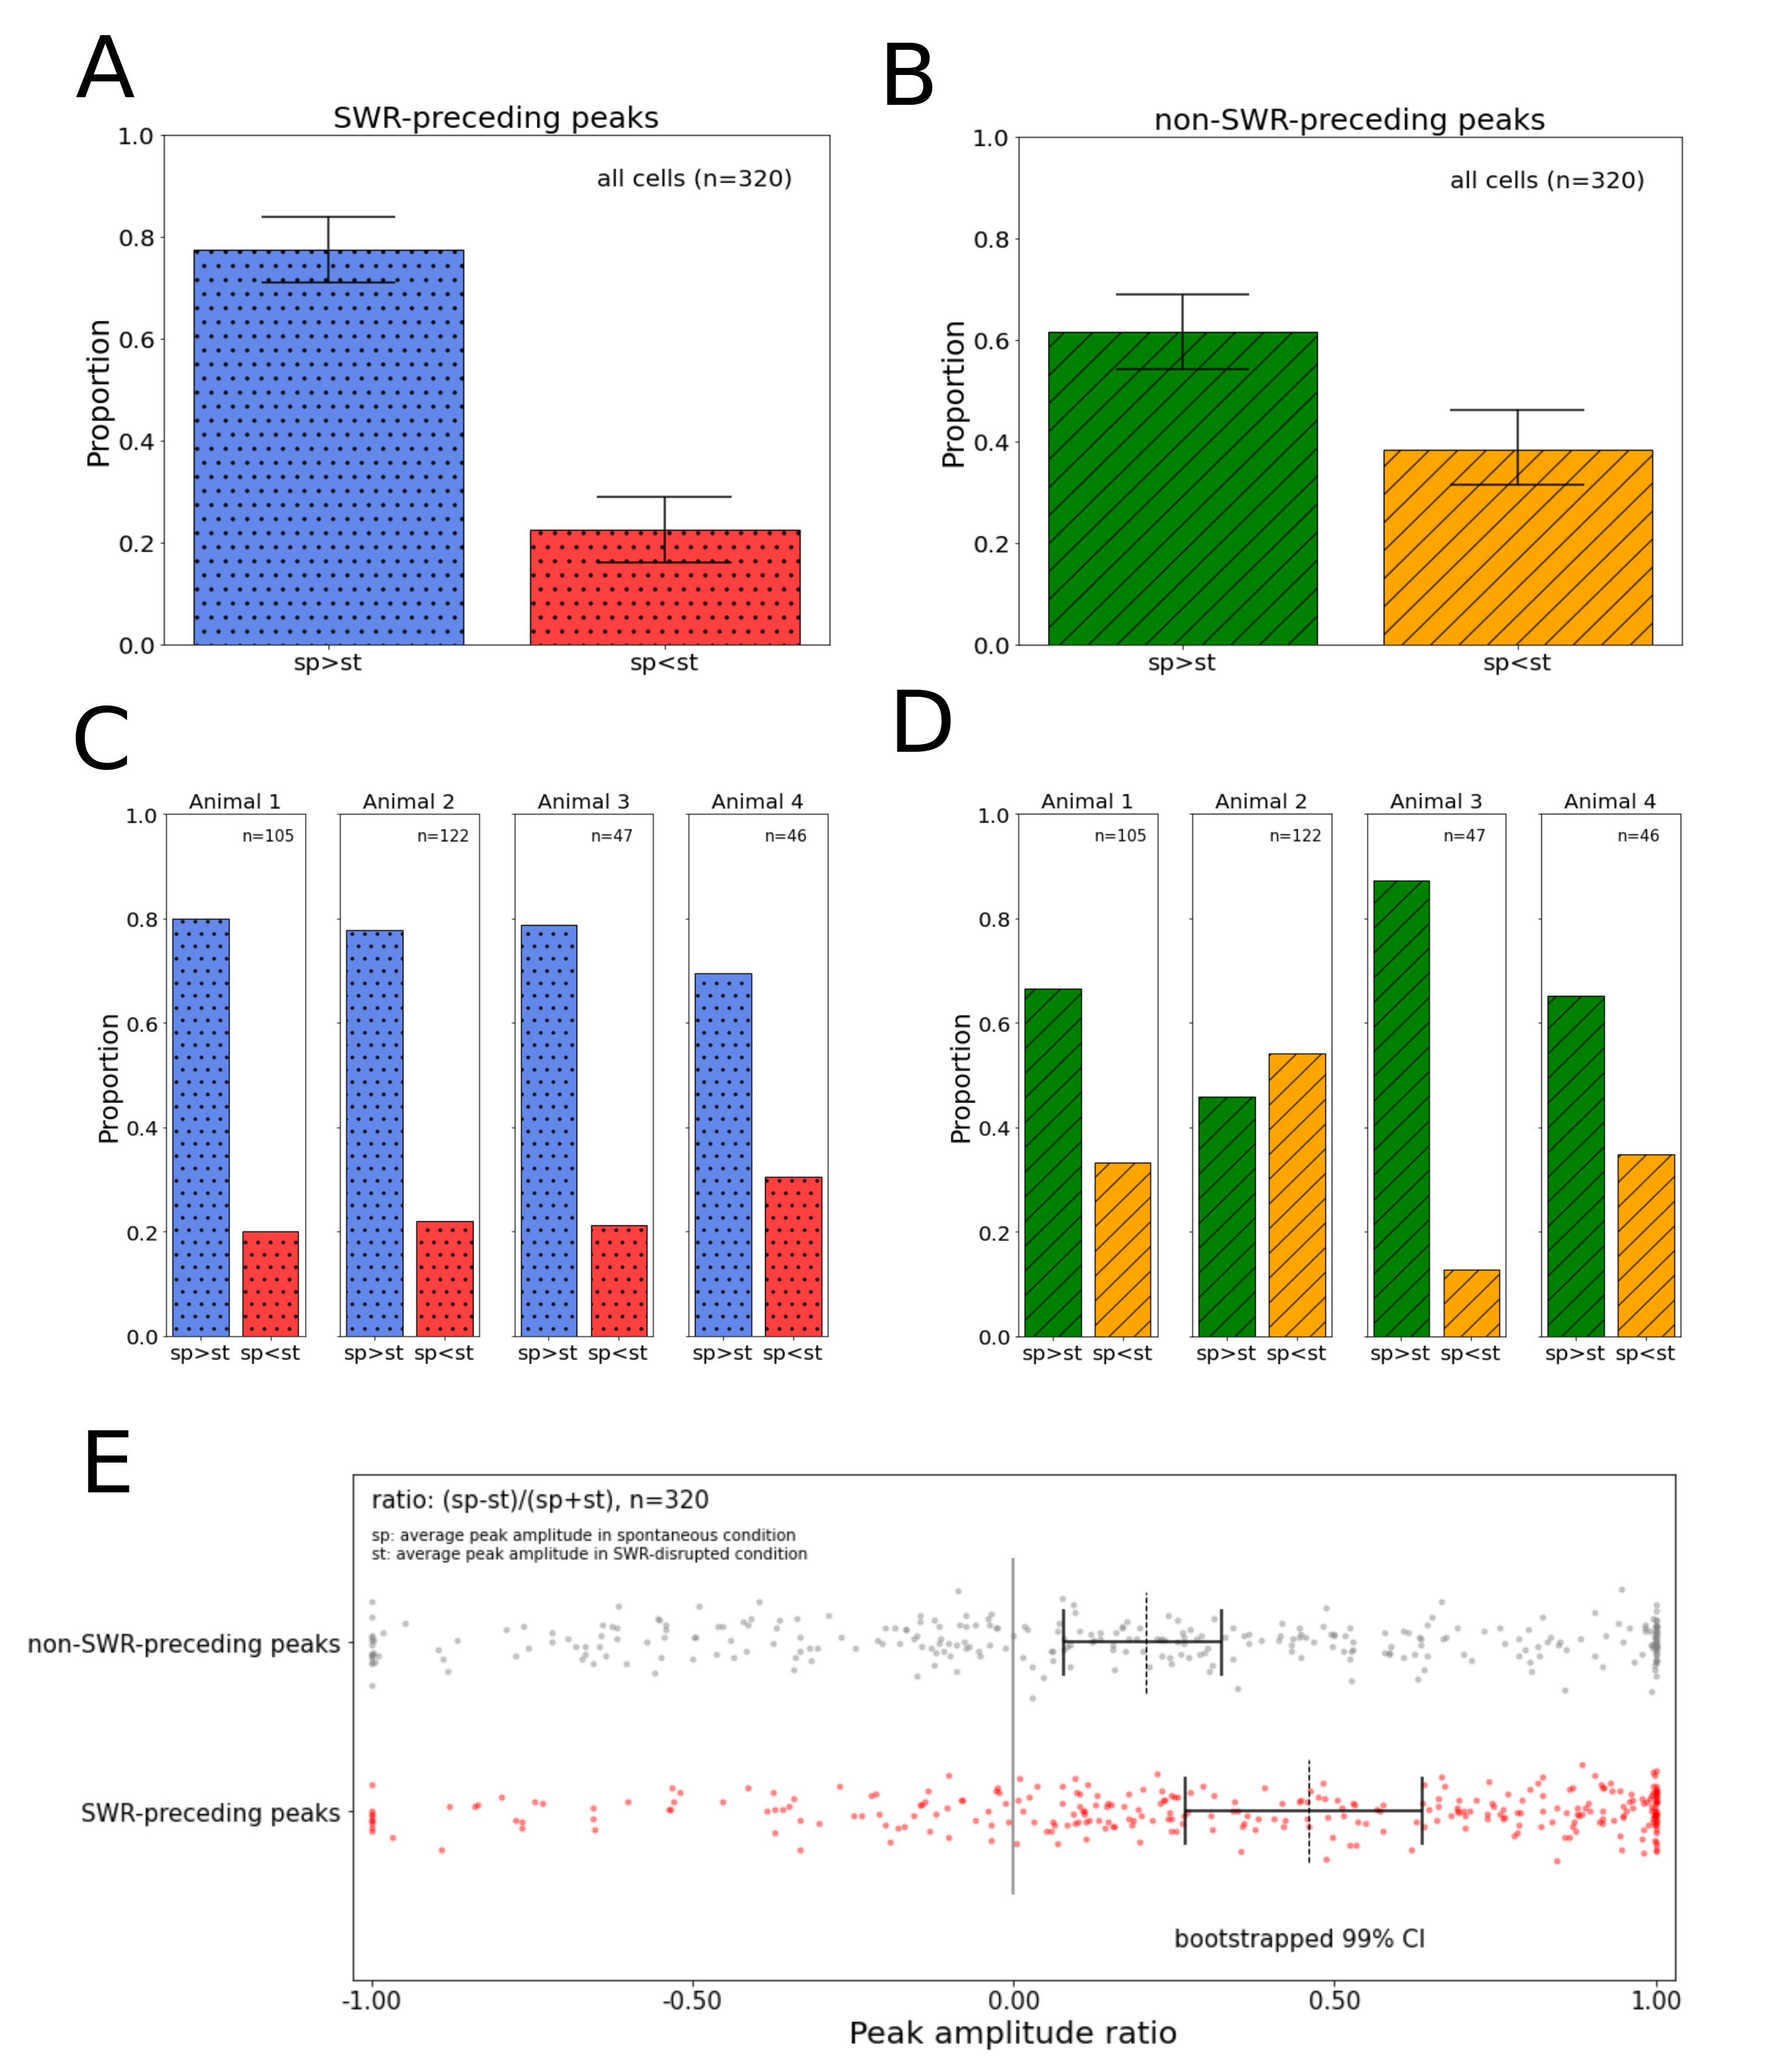
Fig. 5ADifferent subsets of cells respond to SWRs depending on the behavioral state. Calcium peaks from all cells were classified into two categories depending on the presence of preceding SWRs. (A, C): SWR-preceding peaks, (B, D): non SWR-preceding peaks. (A) Proportion of units by the SWR-preceding peak property from all units. Left: proportion of units where the peak amplitude decreased in the SWR-disrupted condition. Right: proportion of units where the peak amplitude increased in the SWR-disrupted condition. (Total units: 320, p-value=4.26e-24, solid: bootstrapped 99% confidence interval). (B) Proportion of units by the non SWR-preceding peak property from all units. Left: proportion of cells for which the peak amplitude decreased in the SWR-disrupted condition. Right: proportion of units where the peak amplitude increased in the SWR-disrupted condition. Proportions of
and
Fig. 5C were statistically compared using a two proportion z-test (p-value<0.001). (Total units: 320, p-value=2.08e-05, solid: bootstrapped 99% confidence interval). (C) Proportion of units by the SWR-preceding peak property from individual animals (Animal 1: 105 units, animal 2: 122 units, animal 3: 47 units, animal 4: 46 units). (D) Proportion of units by the non SWR-preceding peak property from individual animals (Animal 1: 105 units, animal 2: 122 units, animal 3: 47 units, animal 4: 46 units). (E) Distribution of average calcium peak amplitude ratio of SWR-disrupted condition compared to the spontaneous condition of peaks with preceding SWRs (red) and peaks without preceding SWRs (gray) of 90% of units during the whole recording (Wilcoxon rank-sum test, p<0.0001, dashed: median, solid: bootstrapped 99% confidence interval. The gray line indicates where the average calcium peak amplitude in the spontaneous condition is equal to the average calcium peak amplitude in the SWR-disrupted condition).