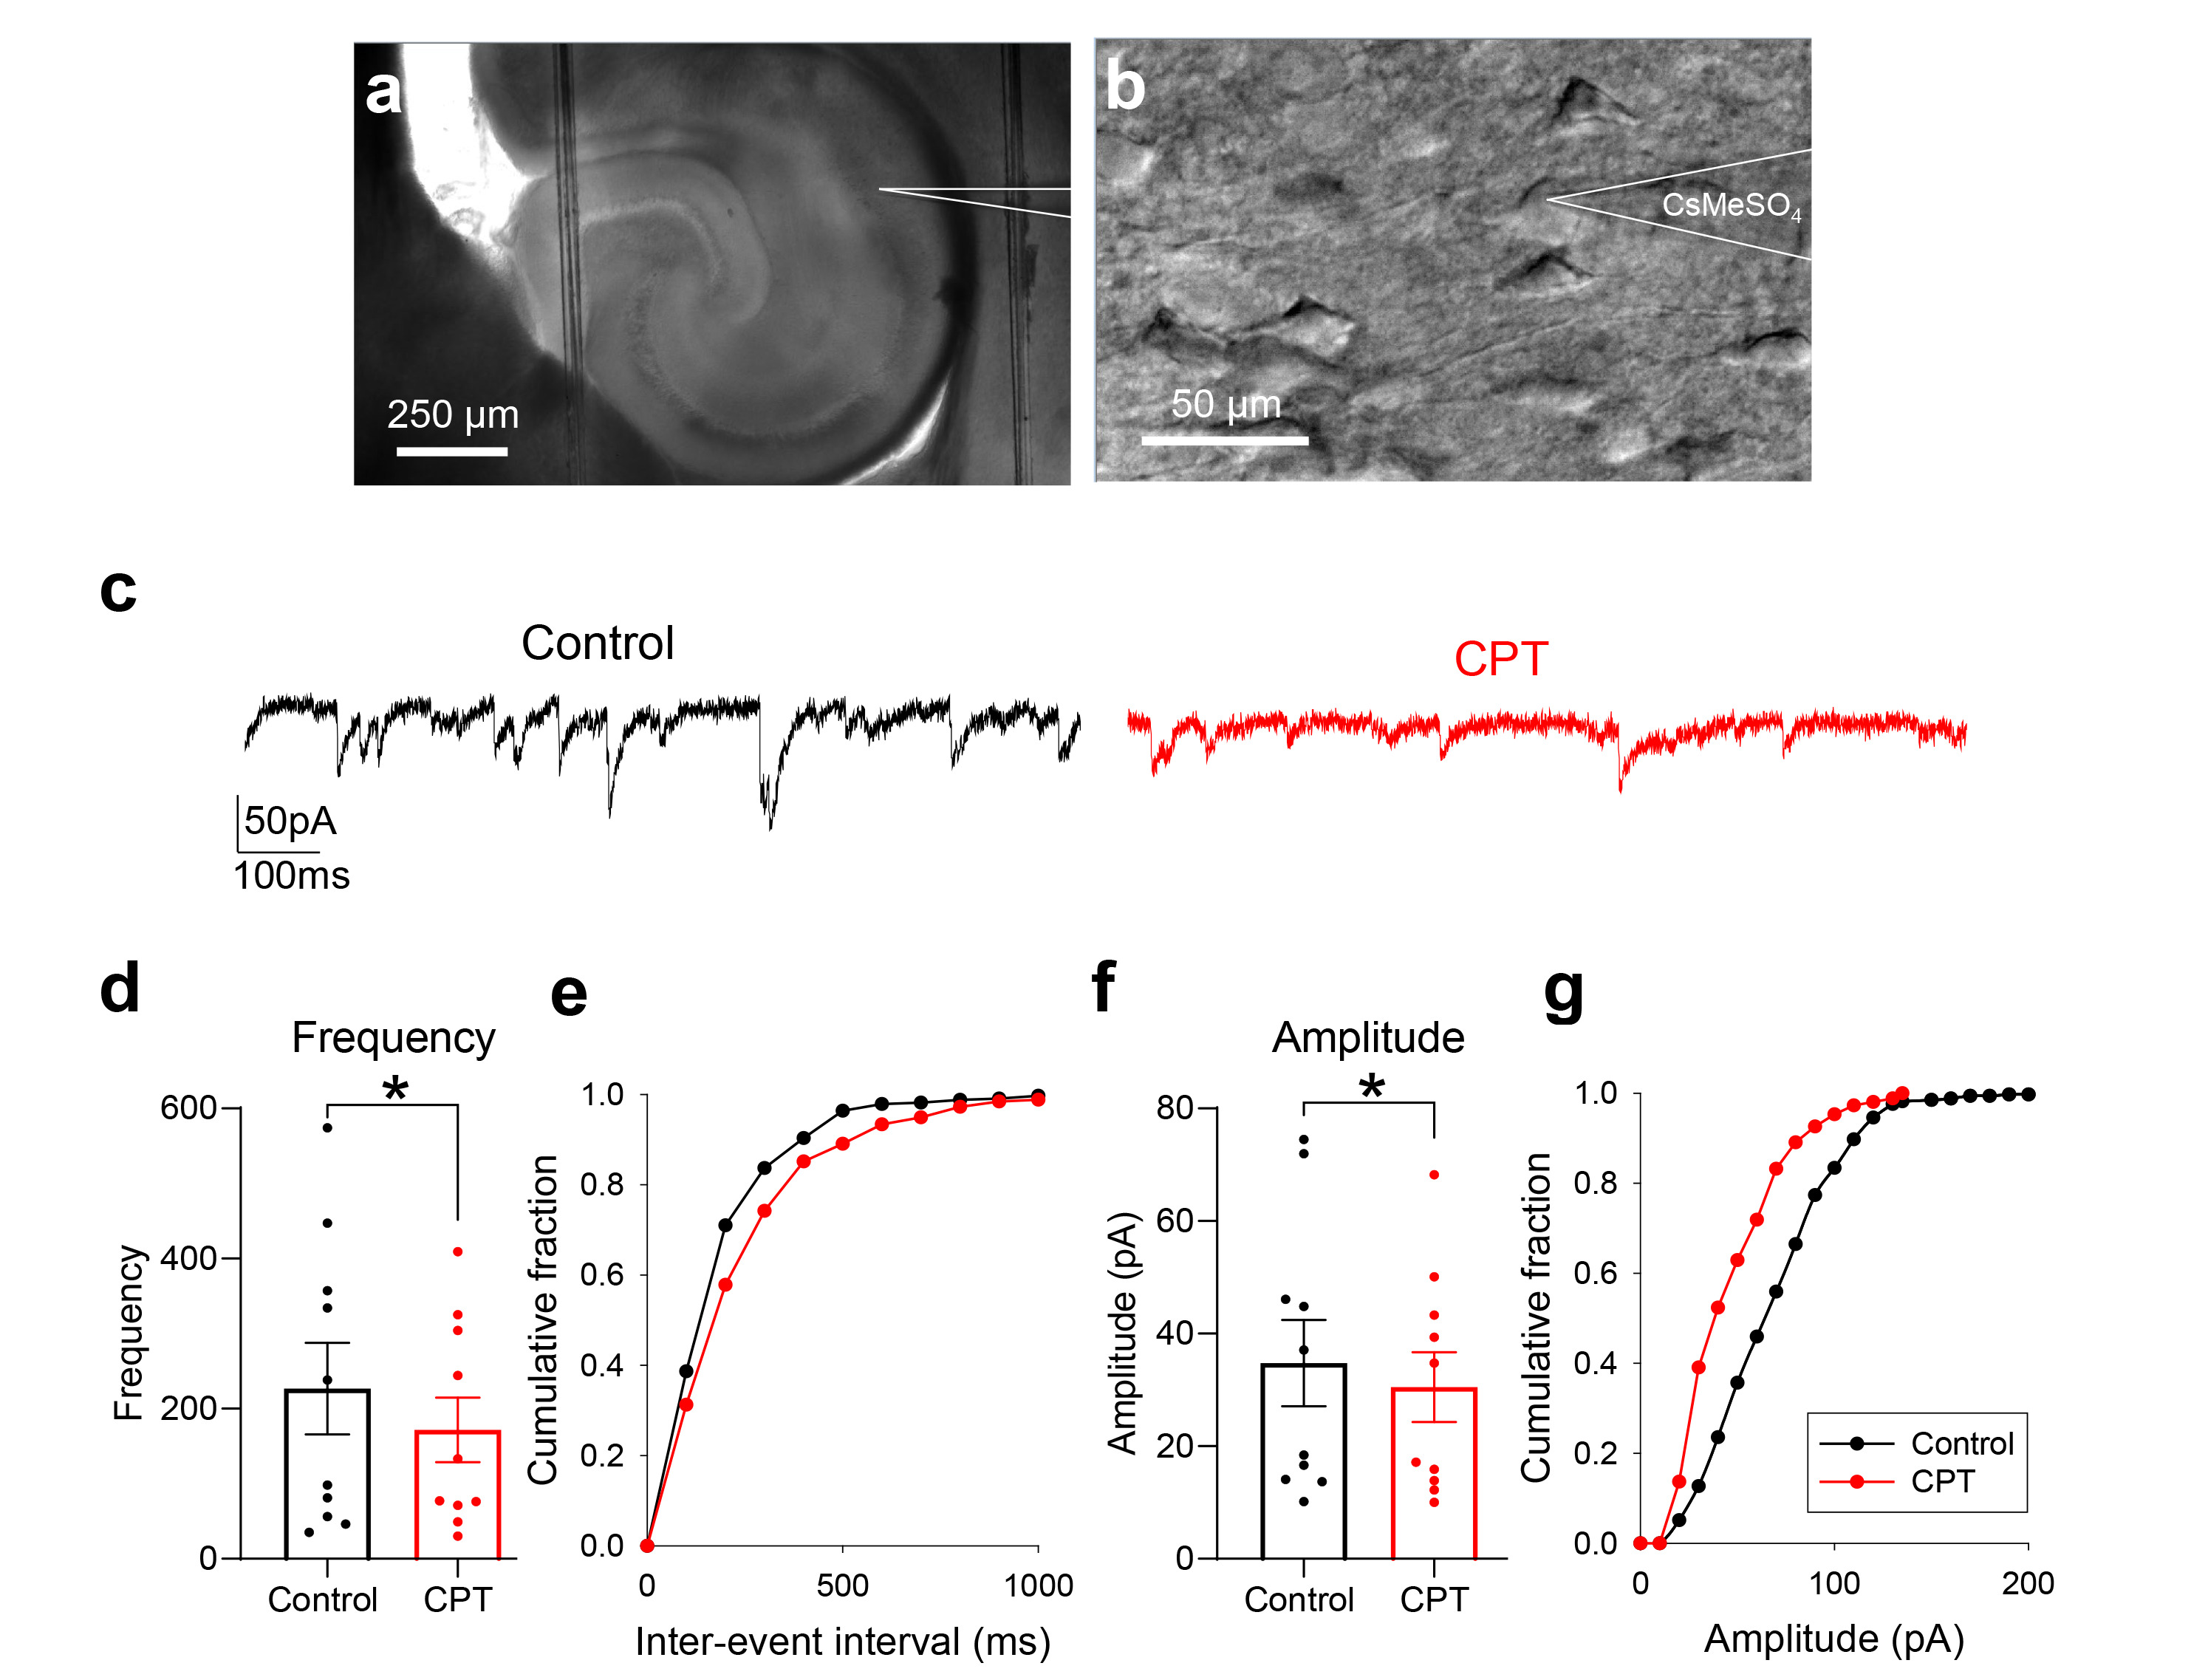
Fig. 3. CPT reduces the frequency of sEPSCs in hippocampal CA1 pyramidal neurons from C57BL/6 mice. (a) Bright field image showing a glass pipette above the hippocampal CA1 region. (b) High-magnification image showing a glass pipette used for whole-cell patch-clamp recording of CA1 pyramidal neurons. (c) Representative trace of sEPSCs before (left panel, black trace; internal solution: 150 mM CsMeSO4 with 0.5 mM QX-314 for Na+ channel blockade; external solution: artificial cerebrospinal fluid [ACSF] containing 130 mM NaCl, Vh=-70 mV) and during the treatment with 10 µM CPT (right panel, red trace; paired comparison with no treatment). (d) Bar graph summarizing the frequencies (paired t test, *p=0.03 n=10). (e) Cumulative fraction of the interevent interval before (black line) and during the treatment with 10 µM CPT (red line). (f) Bar graph summarizing the amplitudes (paired t test, *p=0.04, n=10). (g) Cumulative fraction of the amplitude before (black line) and during the treatment with CPT (red line).
© Exp Neurobiol