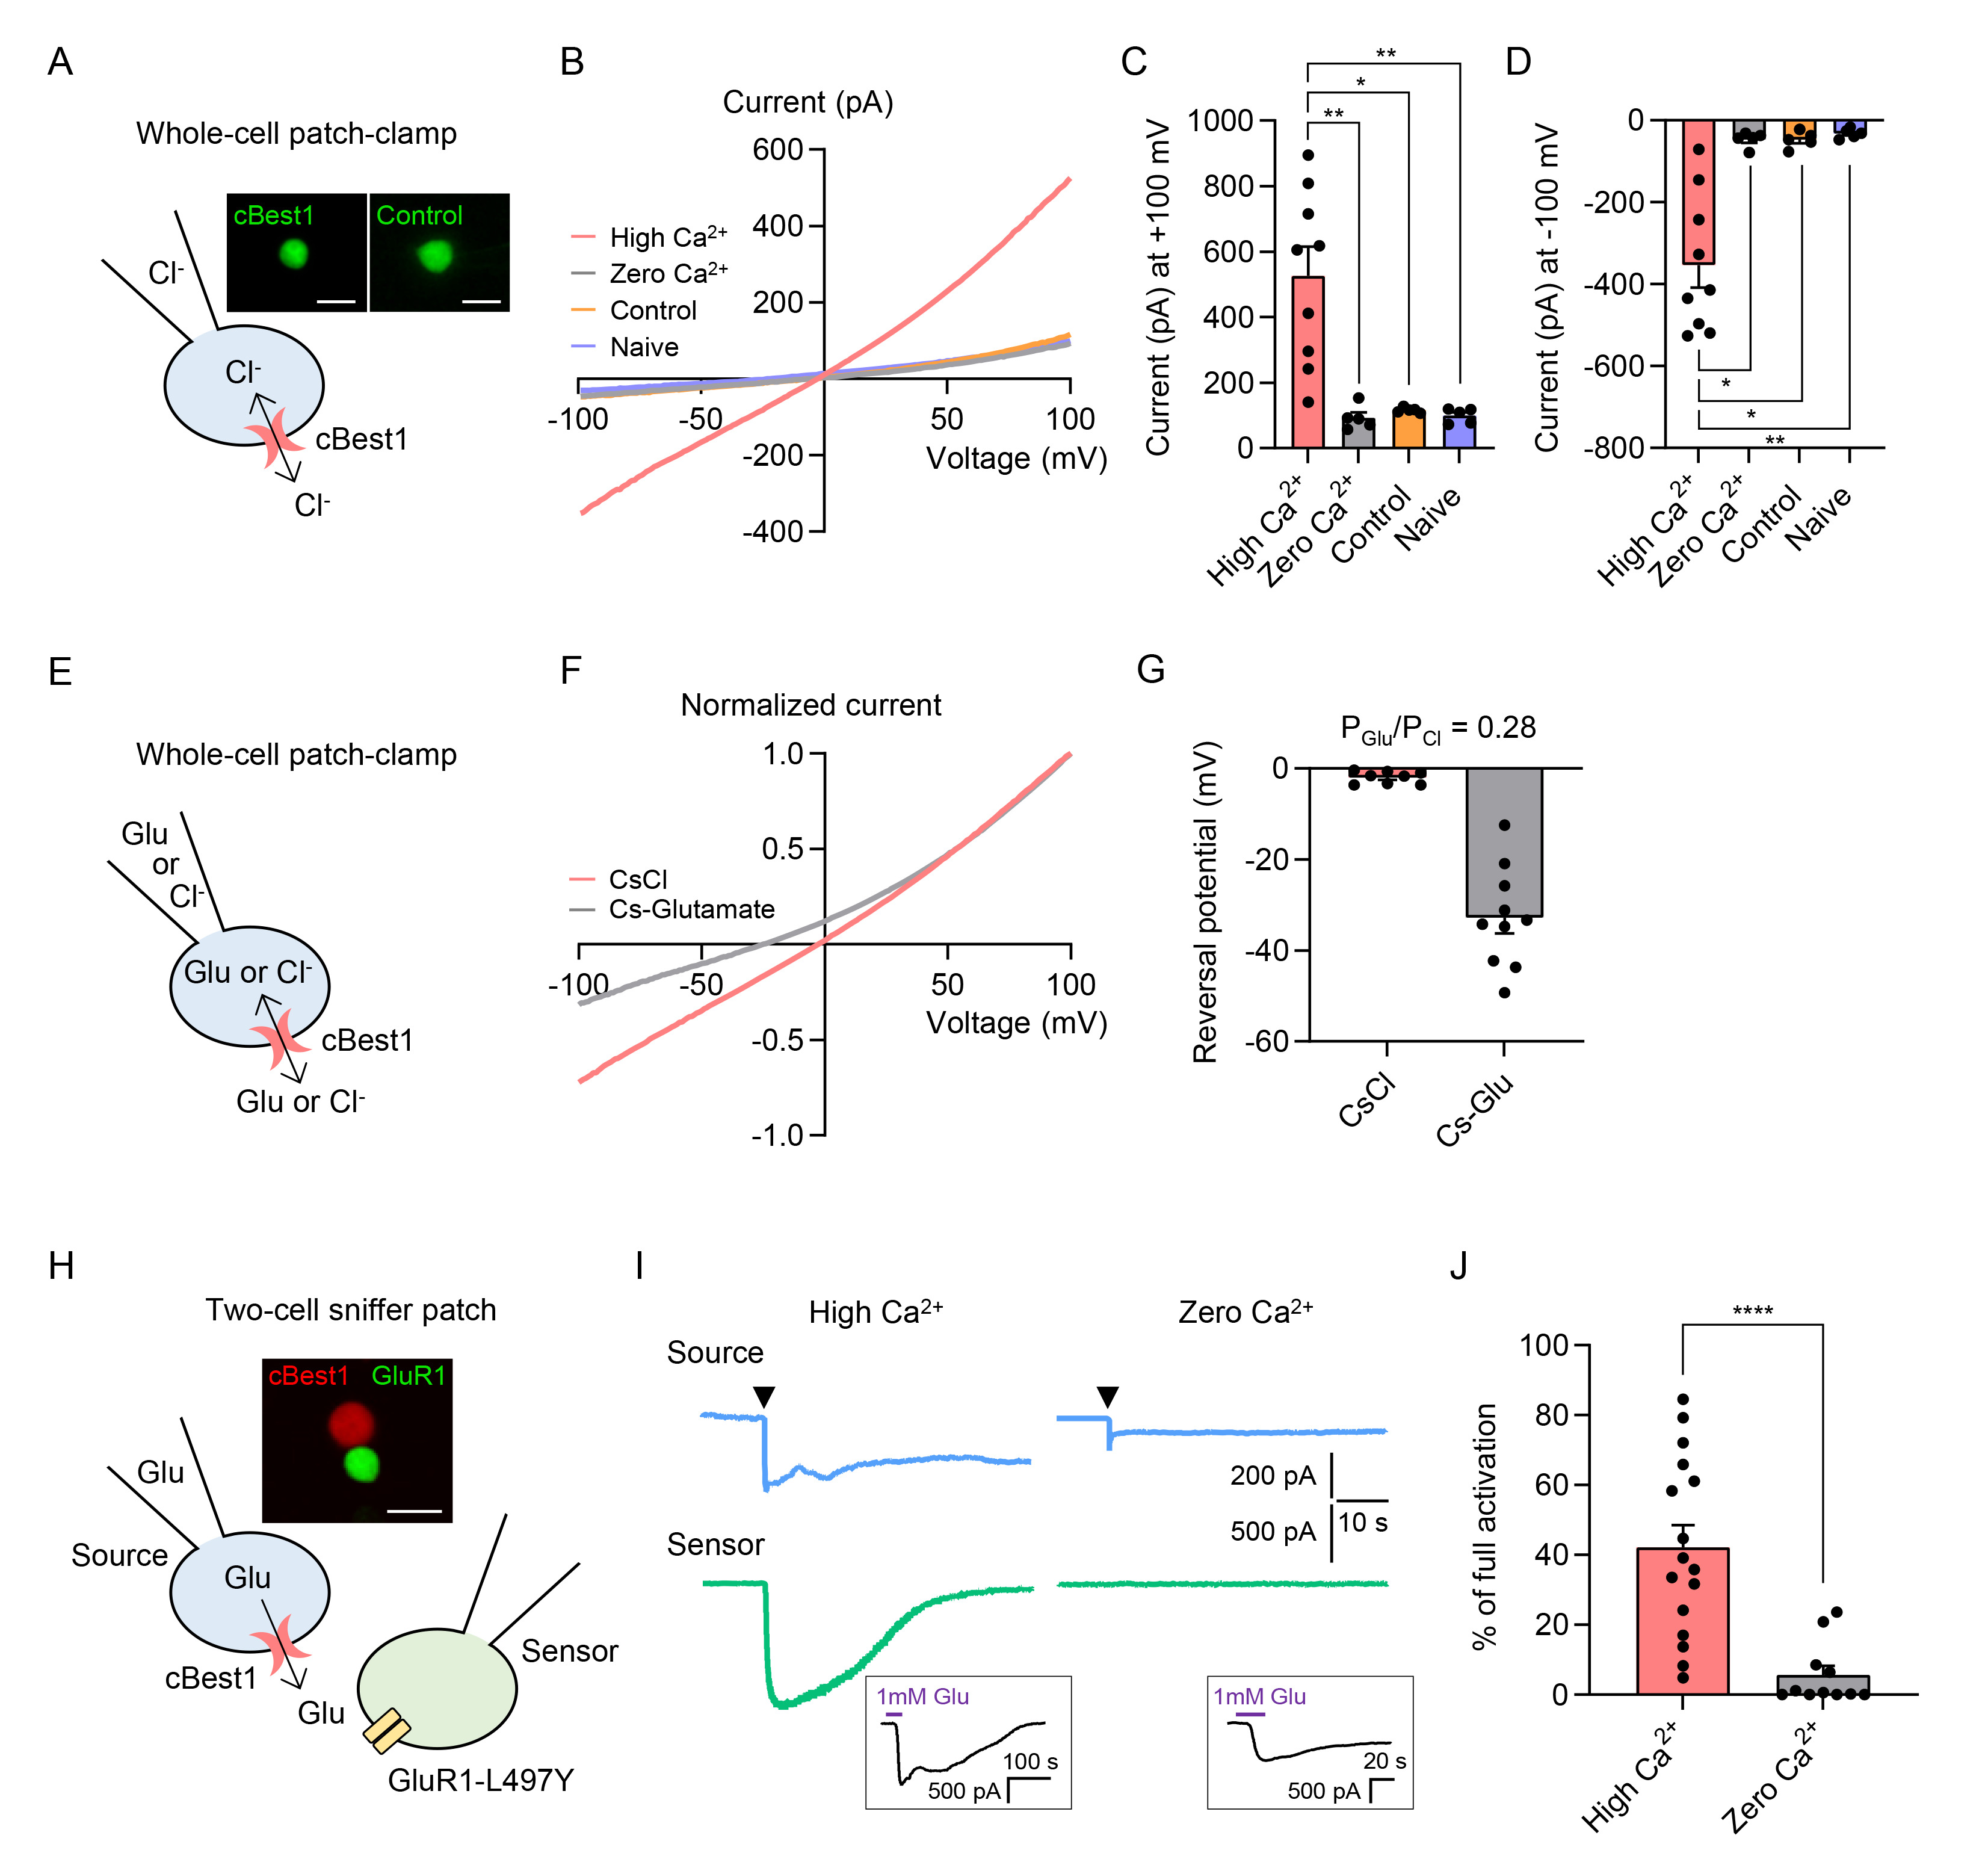
Fig. 3. The cBest1 is a glutamate-permeable channel. (A) Schematic diagram of whole-cell patch-clamp recording from HEK293T cell using 146 mM CsCl-containing internal solution. Inset, fluorescence images of cBest1-IRES2-EGFP (cBest1, left) and pIRES2-EGFP (control, right) in HEK293T cells. Scale bar, 20 µm. (B) Averaged I-V curve in response to the periodic voltage ramp from +100 mV to -100 mV. The internal solution contained 146 mM CsCl with ~4.5 µM Ca2+ (High Ca2+, pink) or 146 mM CsCl with zero Ca2+ (Zero Ca2+, grey) in the cBest1-overexpressing HEK293T cells. The internal solution contained 146 mM CsCl with ~4.5 µM Ca2+ in the control vector-overexpressing HEK293T cells (Control, orange) or untransfected HEK293T cells (Naïve, purple). (C) Summarized scatter bar graphs of current at +100 mV (High Ca2+, n=9; Zero Ca2+, n=5; Control, n=5; Naive, n=5; Dunn’s multiple comparisons test, High Ca2+ vs. Zero Ca2+, p=0.0013; High Ca2+ vs. Control, p=0.0484; High Ca2+ vs. Naïve, p=0.0065). (D) Summarized scatter bar graphs of current at -100 mV (High Ca2+, n=9; Zero Ca2+, n=5; Control, n=5; Naive, n=5; Dunn’s multiple comparisons test, High Ca2+ vs. Zero Ca2+, p=0.0188; High Ca2+ vs. Control, p=0.0296; High Ca2+ vs. Naïve, p=0.0012). (E) Schematic diagram of whole-cell patch-clamp recording from cBest1-overexpressing HEK293T cell using 146 mM CsCl or 146 mM Cs-Glutamate-containing internal solution. (F) Averaged and normalized I-V curve with internal solution containing 146 mM CsCl (pink trace; n=8) or 146 mM Cs-Glutamate (grey trace; n=10). The currents were normalized to each current at +100 mV. (G) Summarized scatter bar graphs of reversal potential. The permeability ratio of glutamate to Cl- (PGlutamate/PCl) was 0.28. (H) Schematic diagram of two-cell sniffer patch with cBest1-overexpressing source cell and GluR1-L497Y-overexpressing sensor cell. Inset, fluorescence images of source (cBest1, red) and sensor (GluR1, green). Scale bar, 20 µm. (I) Representative current traces from source (blue) and sensor (green) cells using the source cell internal solution containing 146 mM Cs-Glutamate with ~4.5 µM Ca2+ (High Ca2+, left) or 146 mM Cs-Glutamate with zero Ca2+ (Zero Ca2+, right). The inverted triangle indicates the time of rupture. Inset, full activation currents from sensor cells by the bath application of 1 mM glutamate (Glu, purple bar). The holding voltage was -70 mV for both source and sensor cells. (J) Summarized scatter bar graphs of the percentage of full activation from sensor cells (High Ca2+, n=16; Zero Ca2+, Unpaired t test with Welch’s correction, p<0.0001). Data are presented as mean±SEM. *p<0.05; **p<0.01; ****p<0.0001.
© Exp Neurobiol