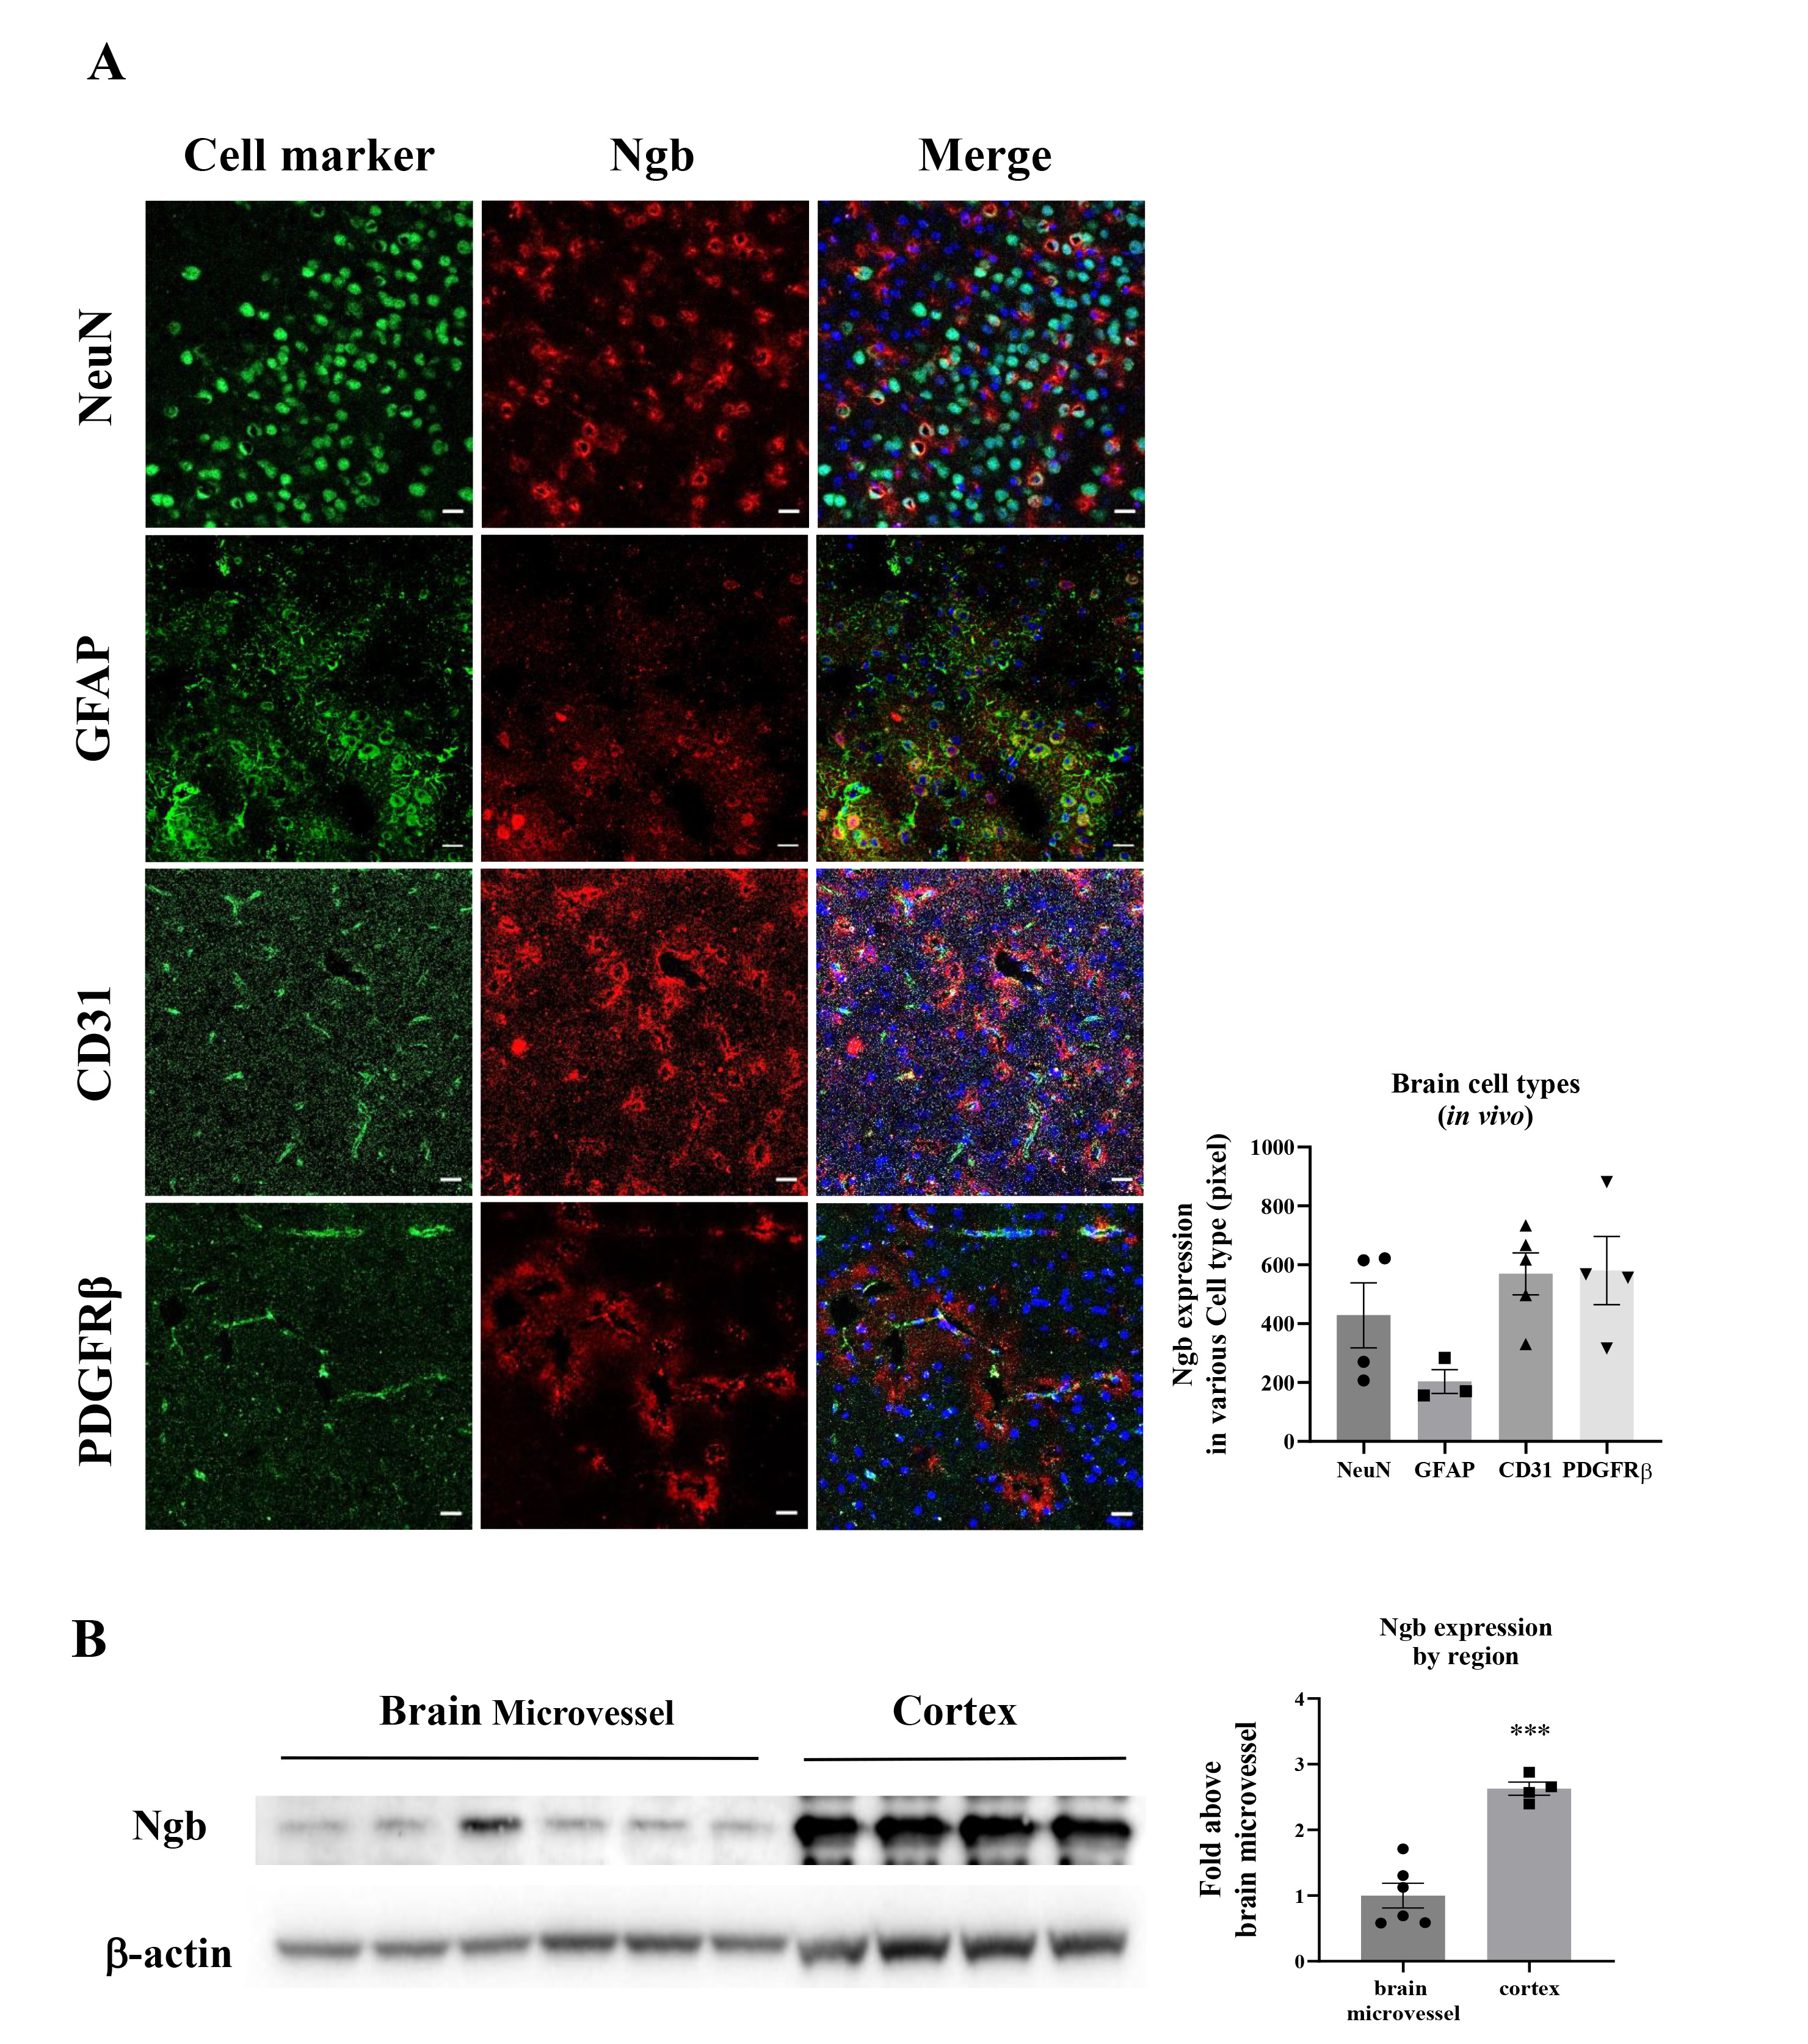
Fig. 1. Neuroglobin (Ngb) expression in the neurovascular unit. (A) The levels of Ngb expression were analyzed by immunofluorescence staining and quantified in various cell types of the mouse brain. Ngb (red) was measured and compared in various cell types (green) of the mouse brain (neuron [NeuN], astrocyte [GFAP], endothelial cell [CD31], and pericyte [PDGFRβ]). (B) Levels of Ngb protein in isolated vessels of mouse brain tissue (microvessel vs cortex) were measured by western blotting. Values are expressed as mean±SD (n=6). (Scale bar=20 µm). ***p<0.001, relative to sham by t-test.
© Exp Neurobiol