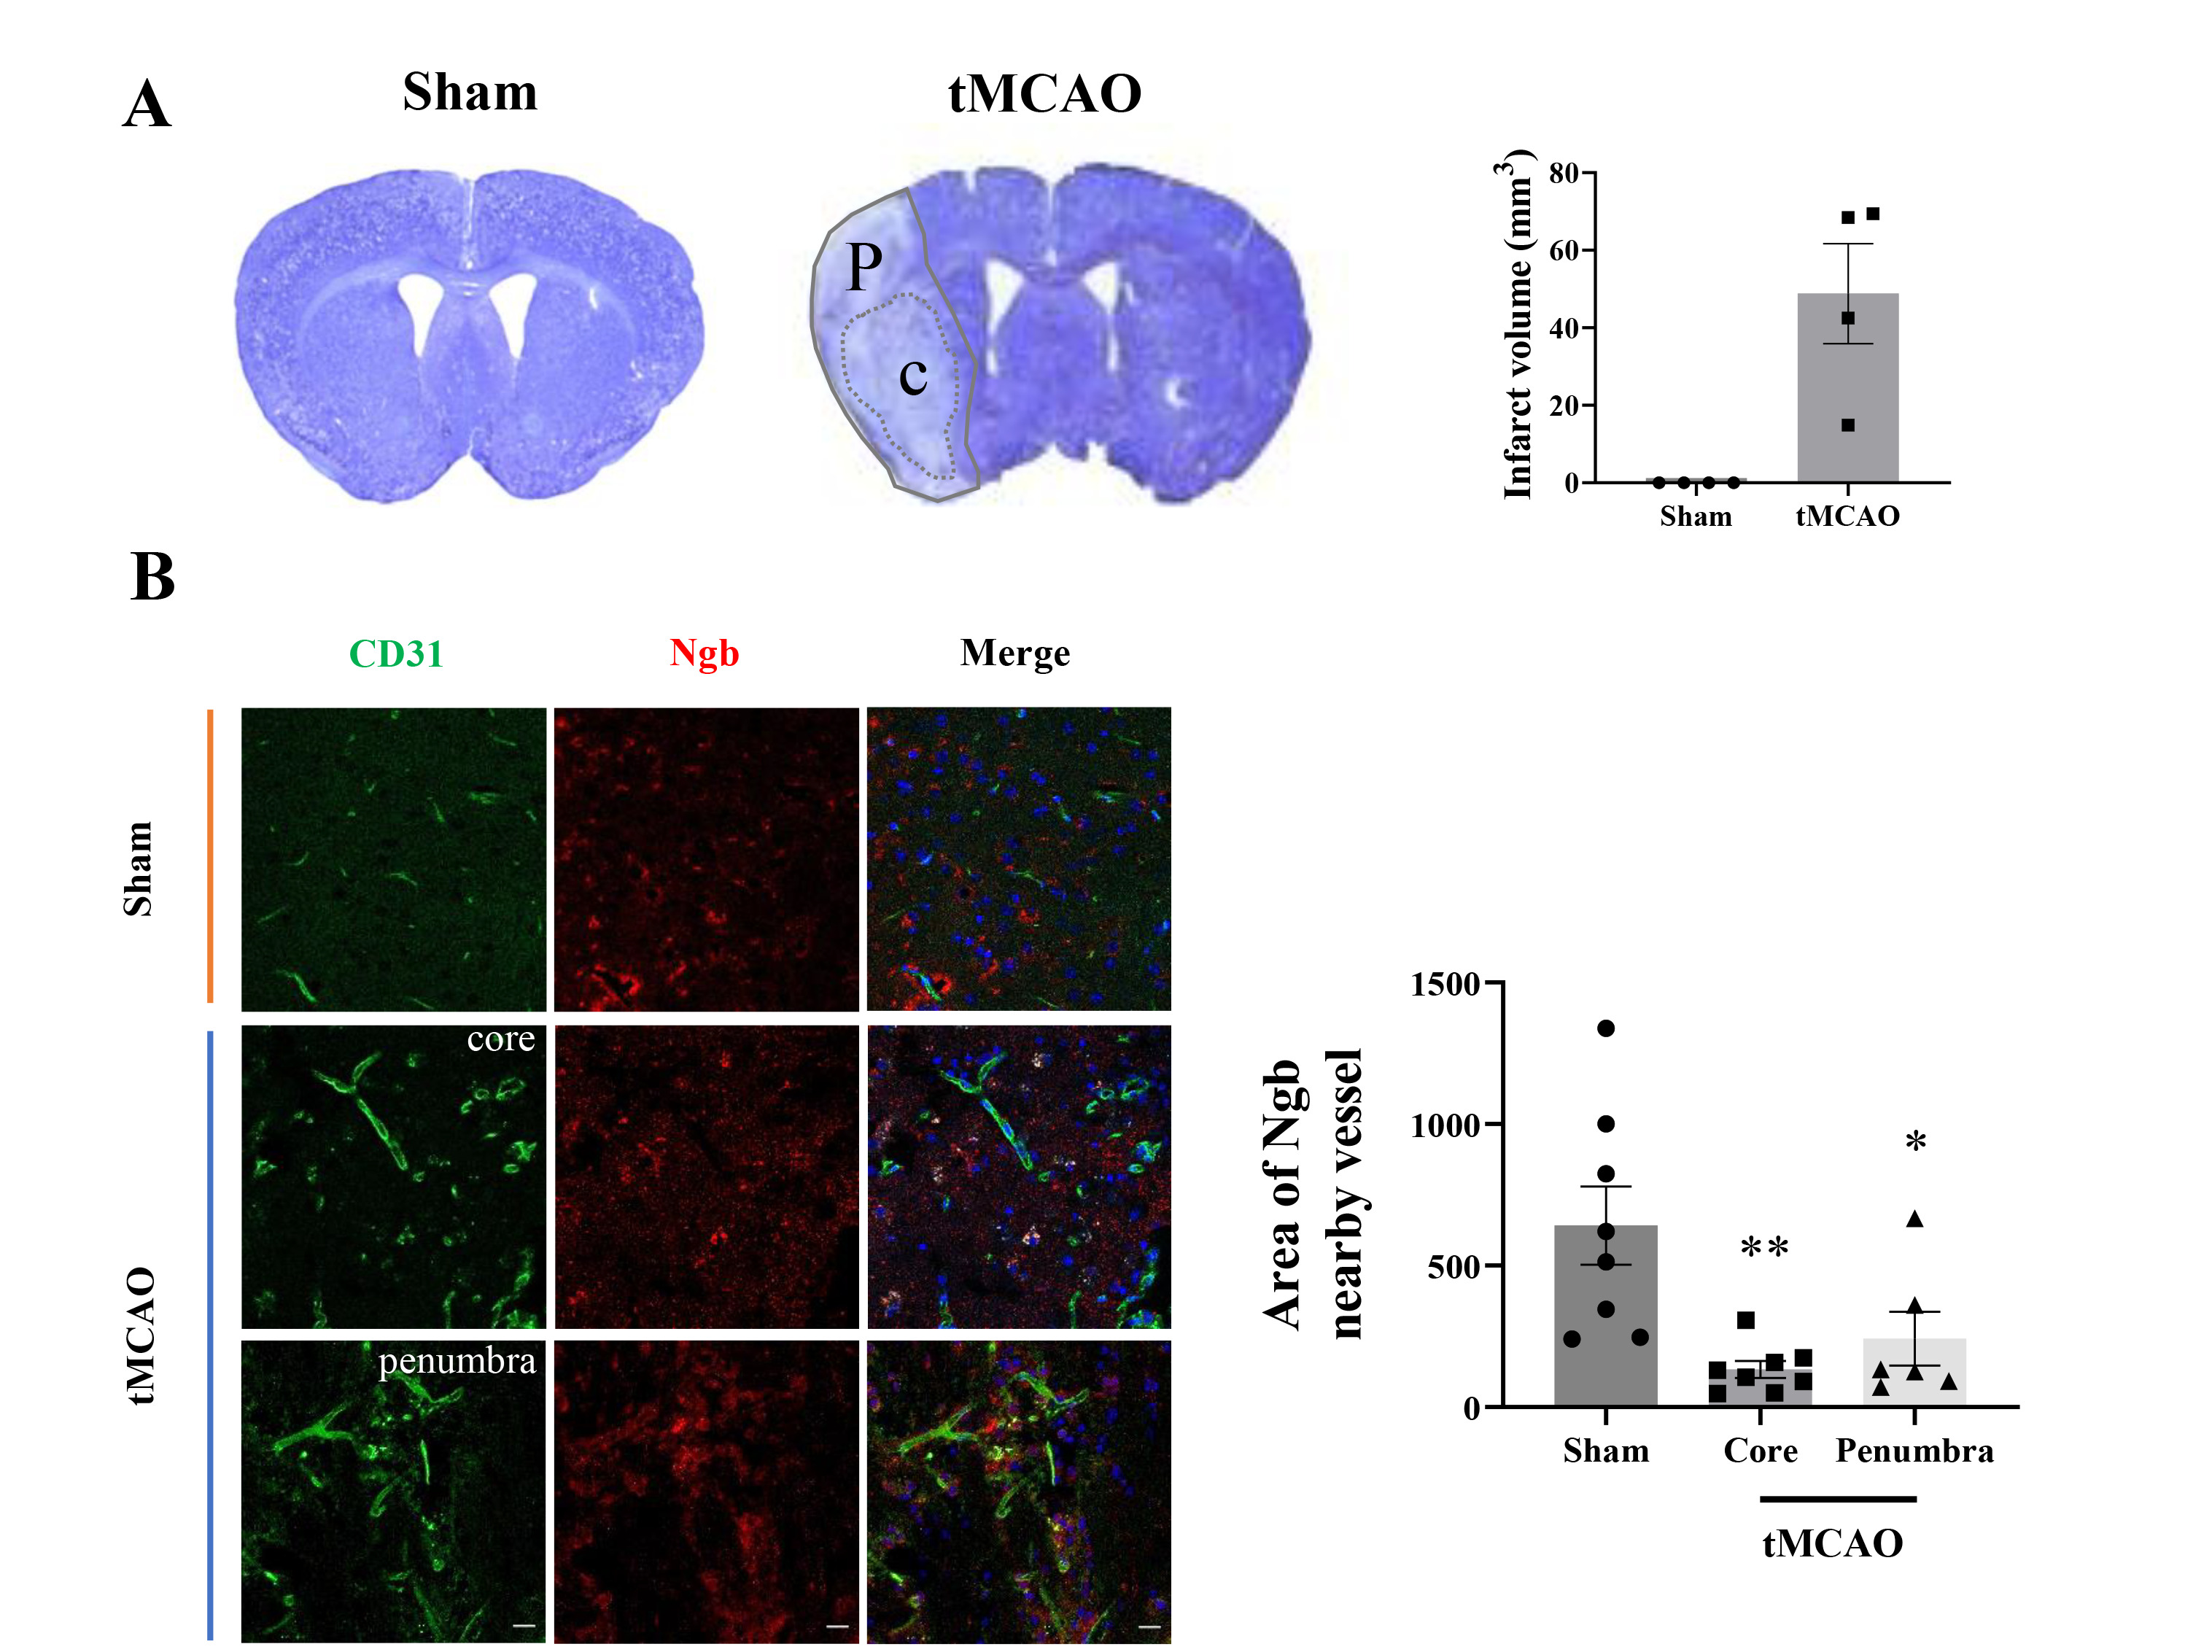
Fig. 2. Differential levels of Ngb in the core and penumbra after transient middle cerebral artery occlusion (tMCAO) in mice. (A) (Left panel) Representative cresyl violet stained sections from sham and tMCAO mice following 24 h of surgery onset. Cresyl violet staining was performed to measure the infarct volume after tMCAO in mice (left: ipsilateral, right: contralateral, C: core, P: penumbra). (Right panel) Graph displays the quantification of measured infarct volume. (B) IHC staining showed the distribution of Ngb (red) near blood vessels (CD31, green) in mouse brain tissue. In the sham group, the Ngb was present around the blood vessels. In the tMCAO group, the level of Ngb in the cerebral core infarct area reduced but increased in the penumbra. (C) Quantification showed that Ngb distribution near vessels is higher in the penumbra than in the core, although it is less than that in the sham group. Values are expressed as mean±SD (n=5). (Scale var=20 µm). *p<0.05, **p<0.01, relative to sham by one-way ANOVA.
© Exp Neurobiol