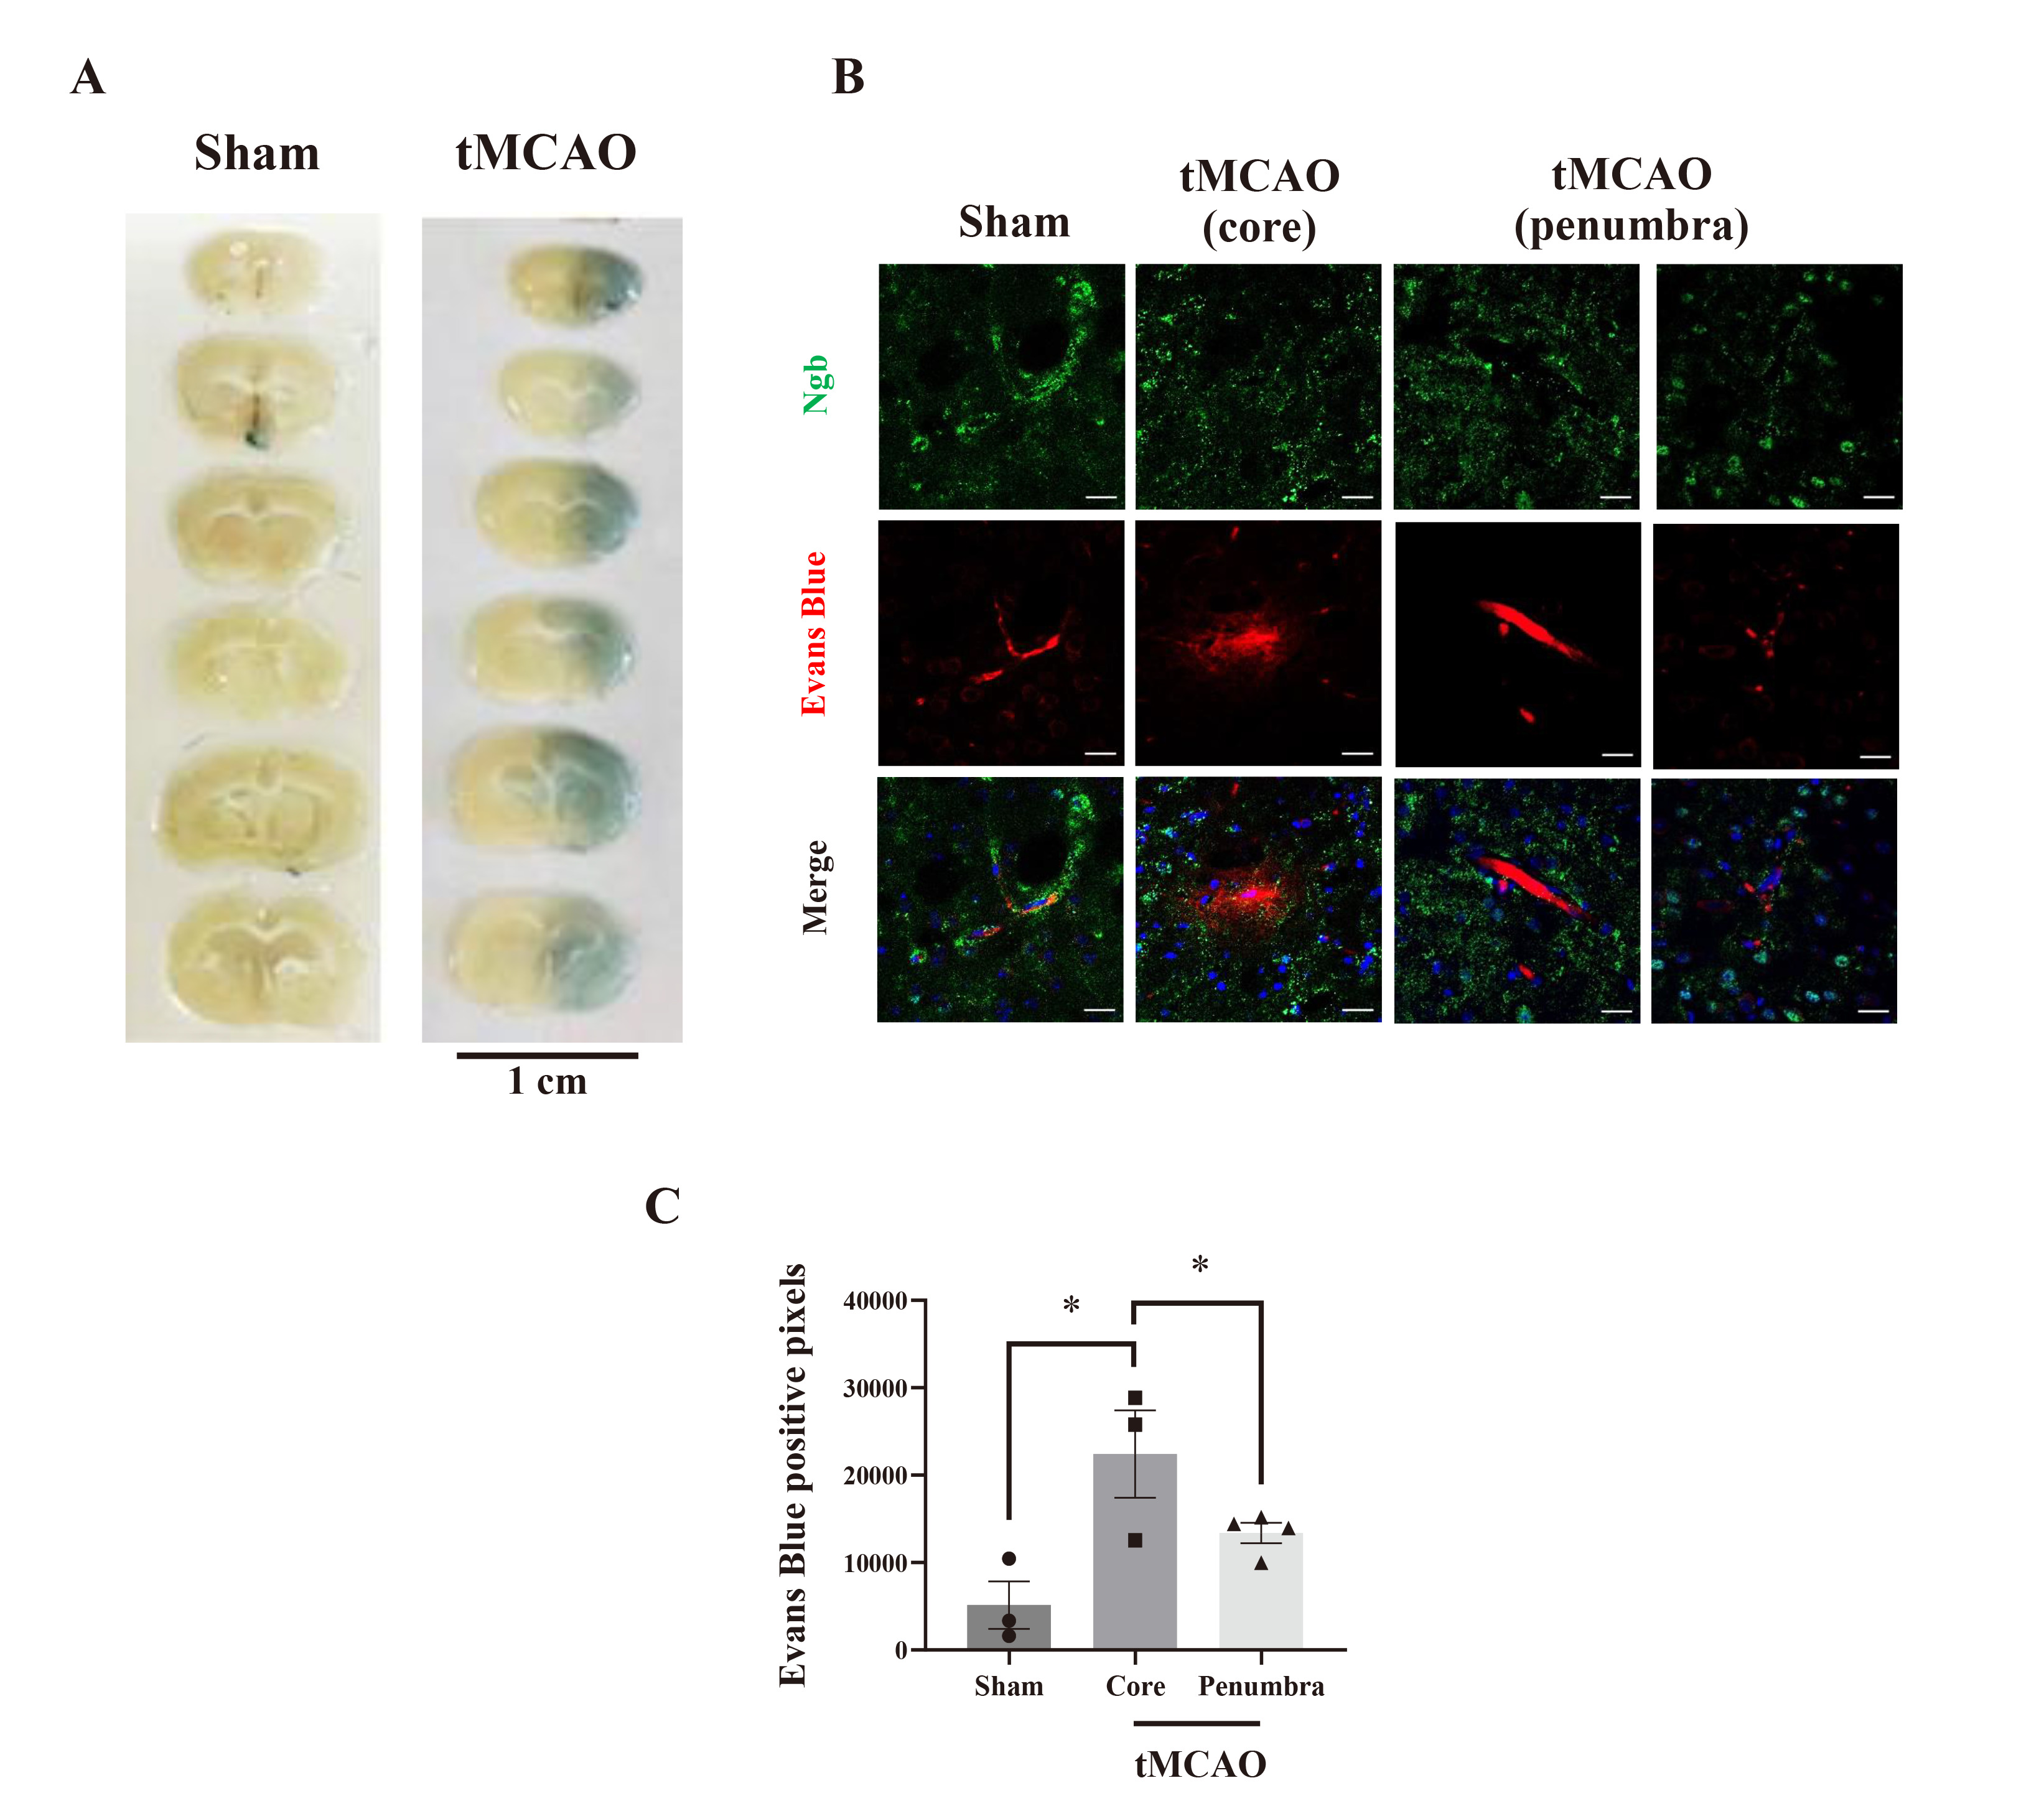
Fig. 4. Barrier function of Ngb-positive pericytes in the penumbra after tMCAO. (A) When Evans blue leaked, the levels of Ngb were simultaneously measured by fluorescence. The Evans blue (blue) leaked from the ipsilateral side blood vessel of the tMCAO group compared with sham when Evans blue was injected with IV 24 hours after tMCAO. (B) Evans blue (red) existed only in blood vessels in the sham group and Ngb (green) was expressed around the blood vessels, whereas Evans blue leaked into the parenchyma around the blood vessels in the tMCAO group. Ngb expressed in the blood vessels in sham mice was no longer expressed in the core of the infarct. (Scale bar=20 µm). (C) Quantification of Evans blue leakage by Image J. Values are expressed as mean±SD (n=4). *p<0.05, Significant differences relative to sham as evaluated by one-way ANOVA, Tukey and relative to the core region in tMCAO, determined by Student’s t-test.
© Exp Neurobiol