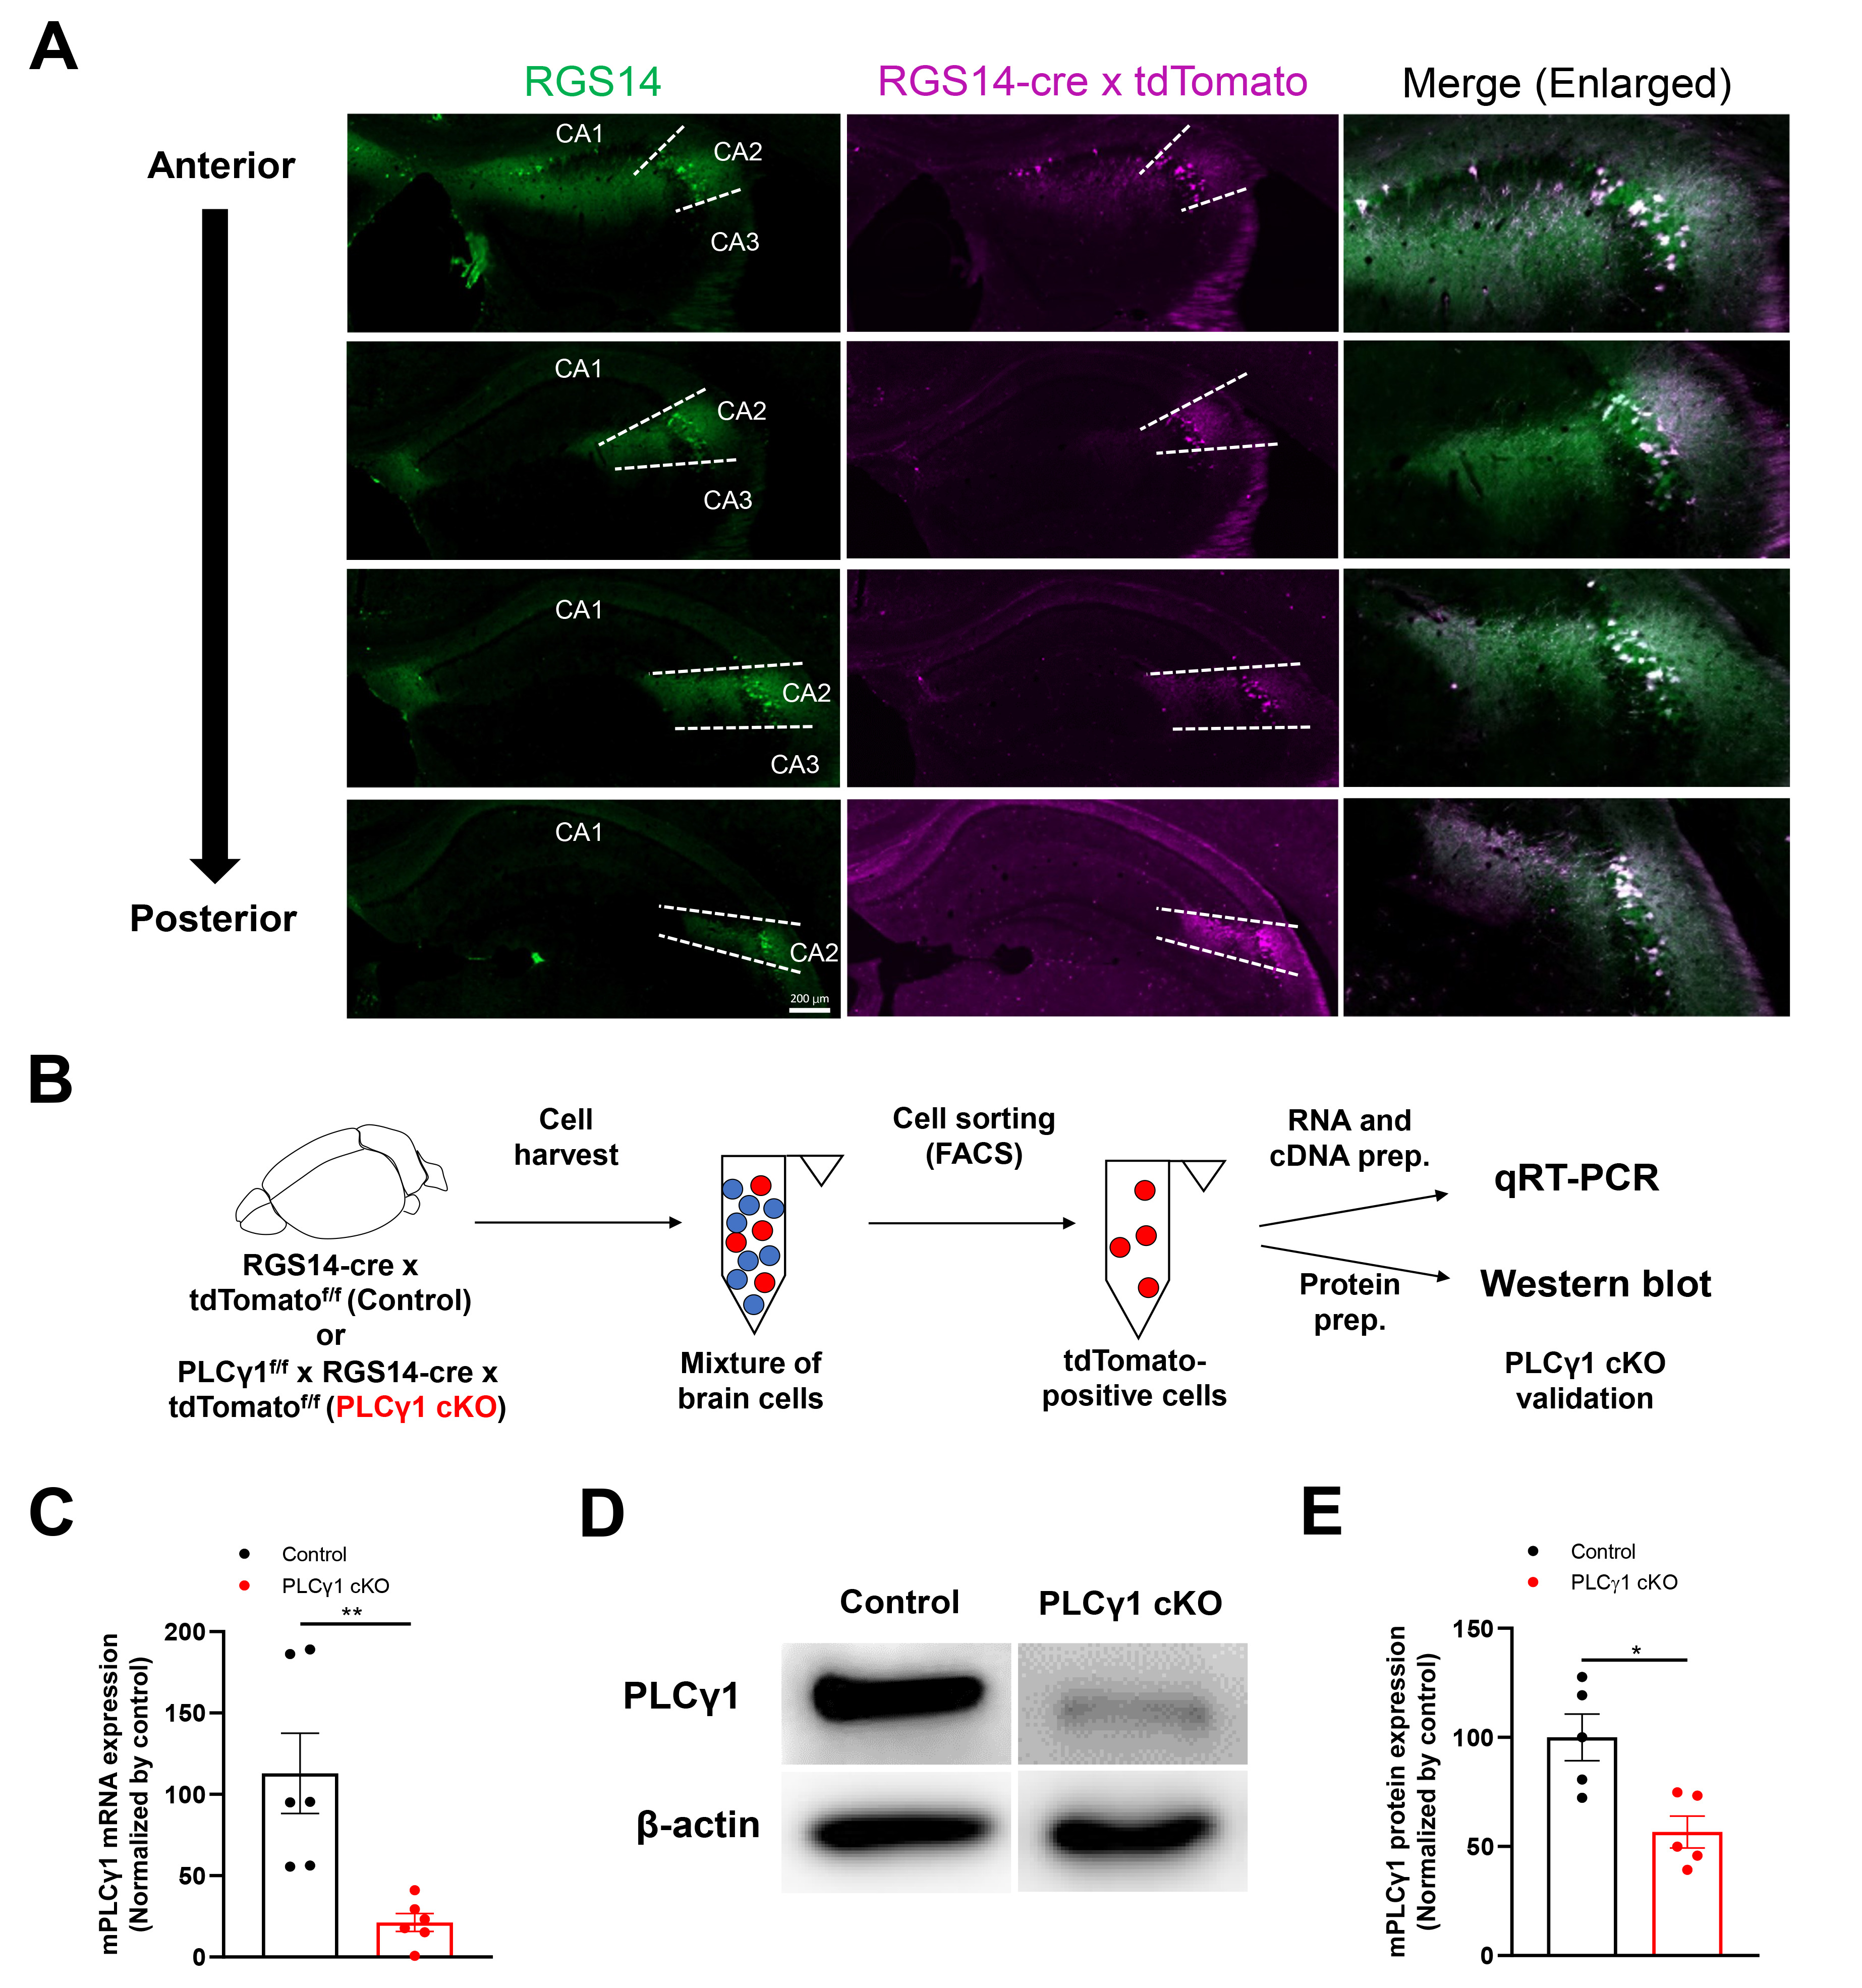
Fig. 3. Validation of CA2-specific expression with RGS14-cre×tdTomatof/f mouse and PLCγ1 knockout with PLCγ1f/f×RGS14-cre×tdTomatof/f triple transgenic mice (A) Representative immunofluorescent images of hippocampus CA2 region of RGS14-cre×tdTomatof/f mouse. Scale bar: 200 μm. (B) Experimental procedure of PLCγ1 KO (PLCγ1 cKO) validation. (C) Summary bar graph of qRT-PCR results (n=6 and 6). Student’s t-test, **p<0.01. (D) Representative western blot result of control and PLCγ1 cKO. (E) Summary bar graph of western blot results from B (n=5 and 5). Student’s t-test, *p<0.05. Results are mean±SEM.
© Exp Neurobiol