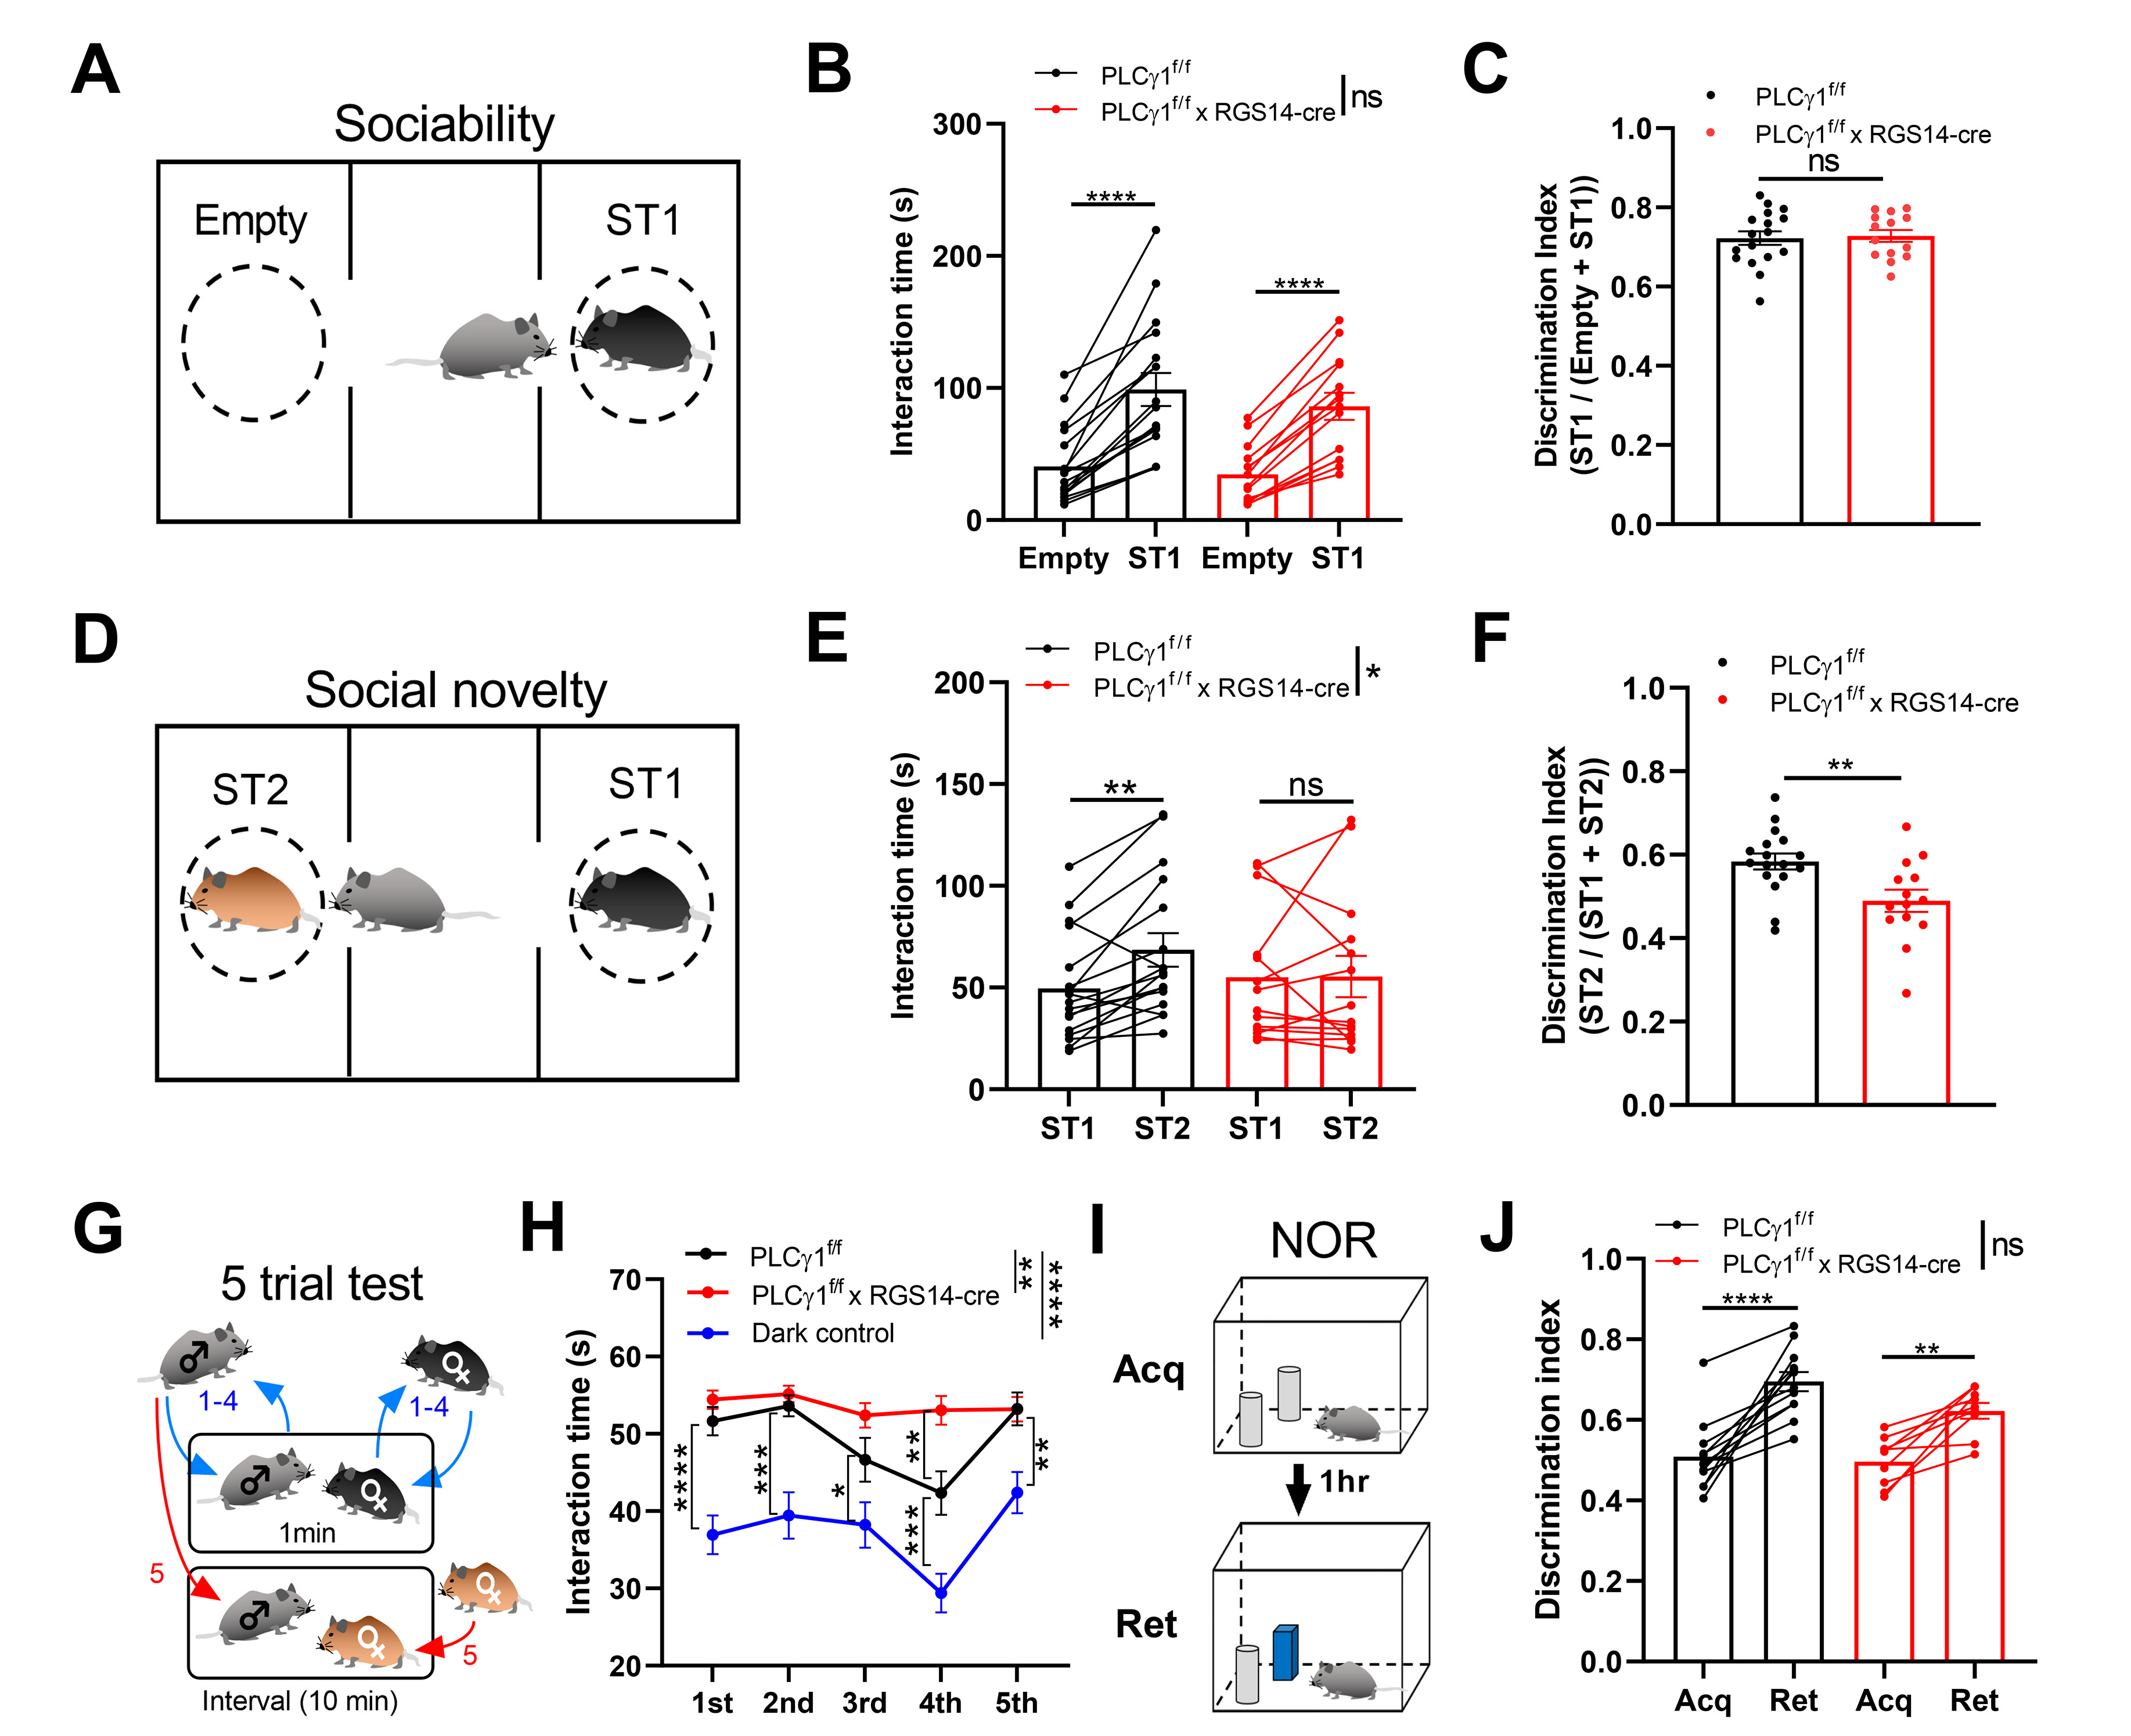
Fig. 4. Deletion of PLCγ1 in CA2 shows intact sociability and object recognition memory but impaired social memory. (A) Schematic illustration of sociability test (ST1, stranger 1). (B, C) Summary bar graphs of interaction time (B) and discrimination index (C) of sociability (n=15 and 18). Two-way ANOVA (B), PLCγ1f/f vs PLCγ1f/f×RGS14-cre, p>0.05; Student’s t-test, Empty vs ST1 in PLCγ1f/f and PLCγ1f/f×RGS14-cre, ****p<0.0001. Student’s t-test (C), ns, not significant. (D) Schematic illustration of social novelty test (ST1, stranger 1; ST2, stranger 2). (E-F) Summary bar graphs of interaction time (E) and discrimination index (F) of social novelty test (n=15 and 18). Two-way ANOVA (E), PLCγ1f/f vs PLCγ1f/f×RGS14-cre, *p<0.05; ST1 vs ST2 in PLCγ1f/f, **p<0.01; ST1 vs ST2 in PLCγ1f/f×RGS14-cre, ns, not significant. Student’s t-test (F), **p<0.01. (G) Schematic diagram of five-trial social memory test. (H) Summary graph of five-trial social memory test with PLCγ1f/f, PLCγ1f/f×RGS14-cre, and dark control conditions (n=17, 14, and 14). Repeated twoway ANOVA, PLCγ1f/f vs PLCγ1f/f×RGS14-cre, **p<0.01; PLCγ1f/f vs dark control, ****p<0.0001; PLCγ1f/f vs dark control in 3rd trial, *p<0.05; PLCγ1f/f vs PLCγ1f/f×RGS14-cre in 4th trial and PLCγ1f/f vs dark control in 5th trial, **p<0.01; PLCγ1f/f vs dark control in 2nd and 4th trials, ***p<0.001; PLCγ1f/f vs dark control in 1st trial, ****p<0.0001. (I) Schematic illustration of novel object recognition test (NOR, Acq, acquisition; Ret, retention). (J) Summary bar graphs of discrimination index of NOR (n=8 and 11). Two-way ANOVA, PLCγ1f/f vs PLCγ1f/f×RGS14-cre, p>0.05; Student’s t-test, Acq vs Ret in PLCγ1f/f, **p<0.01; Acq vs Ret in PLCγ1f/f×RGS14-cre, ****p<0.0001. Results are mean±SEM.
© Exp Neurobiol