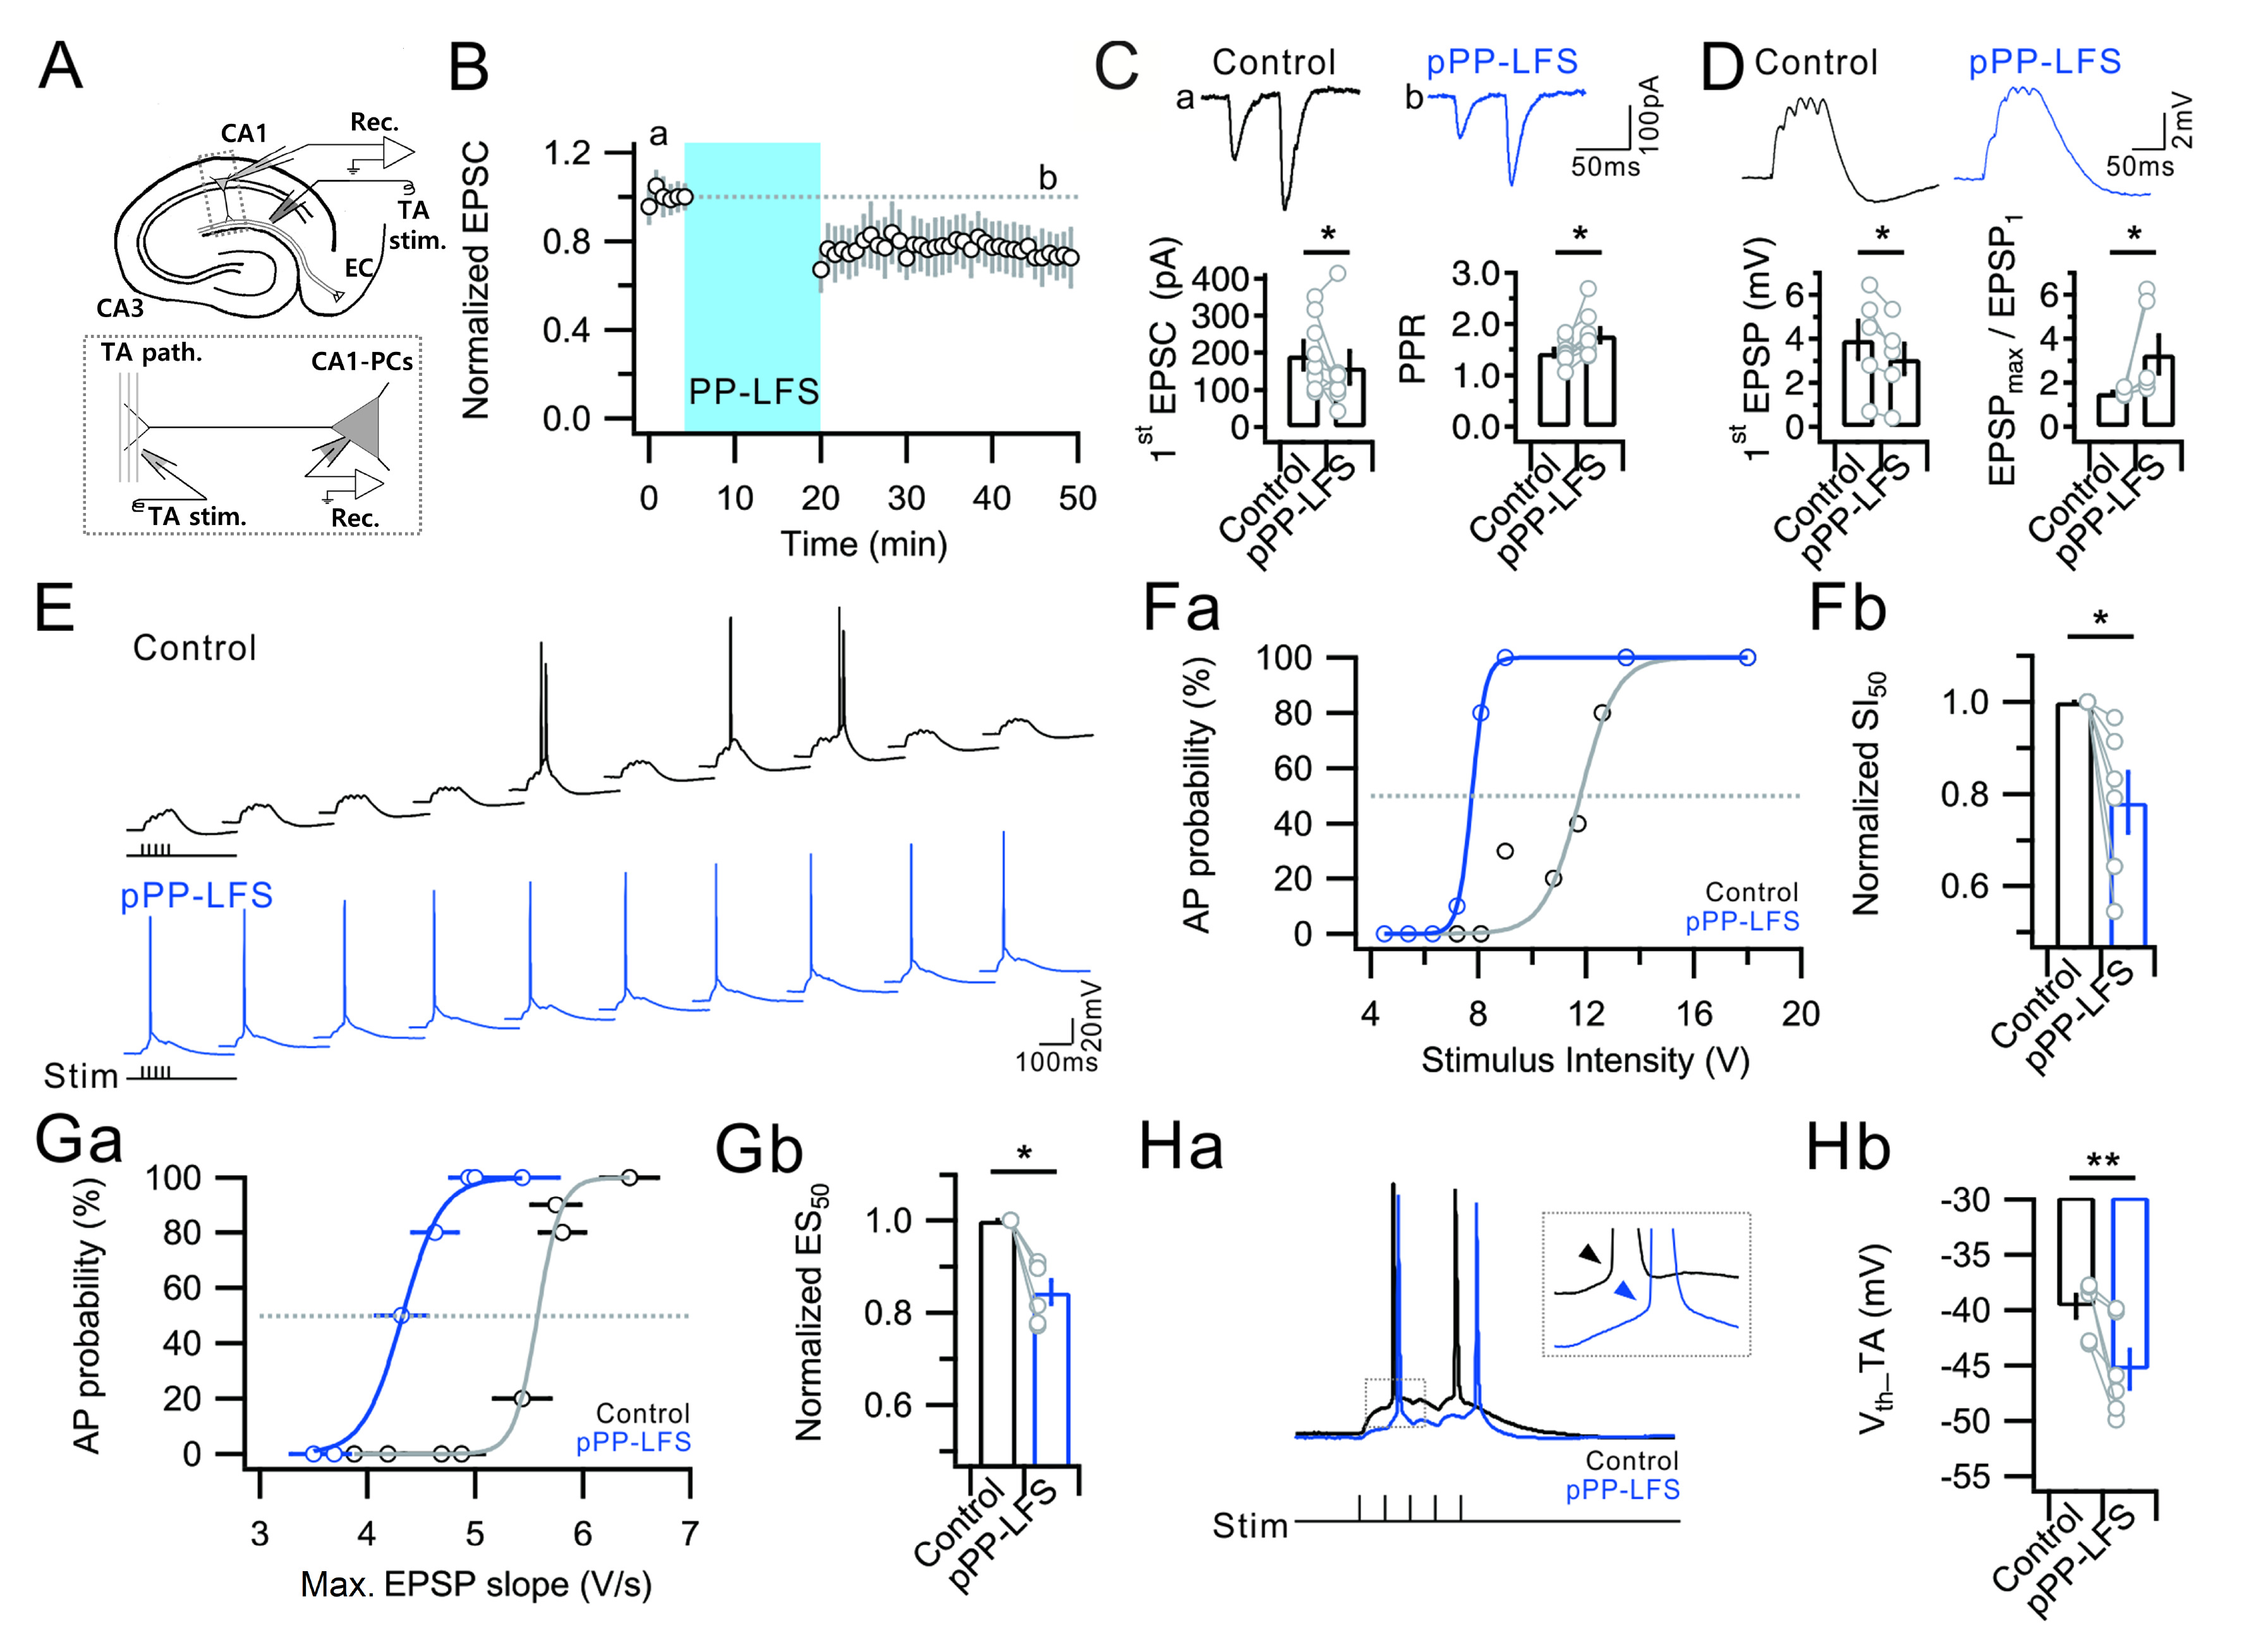
Fig. 1. Induction of E-S potentiation during the LTD by PP-LFS of SLM. (A)
Upper: Recording set up. A whole-cell configuration was established in CA1-PCs of hippocampal slice. Stimulating electrodes were placed in the CA1-SLM. The gray box that contains CA1-PCs and axons from entorhinal cortex was magnified to lower figure.
Lower: Magnified image from gray box in the upper figure. Glass monopolar electrode was placed near the distal dendrites of CA1-PCs and whole-cell configuration was formed in CA1-PC soma. (B) The PP-LFS of TA-CA1 synapses induced TA-LTD amplitude. (C)
Upper: Representative TA-EPSCs recorded before PP-LFS induction (a, Control) and 25~30 min after PP-LFS (b, pPP-LFS).
Lower, left: Change of 1
st TA-EPSC for the control and pPP-LFS.
Lower, right: Change of PPR for the control and pPP-LFS. (D)
Upper: Voltage responses to 5 pulses at 50 Hz of subthreshold stimulation for the control and the pPP-LFS.
Lower, left: 1
st EPSP amplitude for the control and pPP-LFS.
Lower, right: Ratio between the amplitude of maximal depolarization (EPSP
max) evoked by the 5 pulses at 50 Hz and 1
st EPSP amplitude (EPSP
max/EPSP
1 ratio) for the control and the pPP-LFS. (E) Raw voltage traces as a result of 10 trials of TA burst stimulation (5 stimuli, 50 Hz, 2 s interval) for the control and the pPP-LFS. For the pPP-LFS, the 10 trials of TA bursts triggered firing in all trials, in contrast of the control. (Fa) Graph showing distribution of AP probability as a function of stimulus voltage for the control and pPP-LFS. (Fb) Bar graphs and circles represent that average and individual normalized SI
50 is significantly decreased after PP-LFS, respectively. (Ga) Graph showing distribution of firing probability as a function of Max. EPSP slope for the control and the pPP-LFS. (Gb) Bar graphs and circles represent that average and individual Normalized ES
50 is significantly decreased after PP-LFS, respectively. (Ha) Voltage responses to 5 trials of suprathreshold TA burst stimulation for the control and the pPP-LFS.
Insets: Change of V
th_TA for the control and the pPP-LFS were indicated with arrowheads. (Hb) Bar graphs representing significant V
th hyperpolarization that AP induced by theTA burst stimulation (V
th_TA). Error bars indicate SEM. For the experiments of
Figure 1, 9 mice were used.