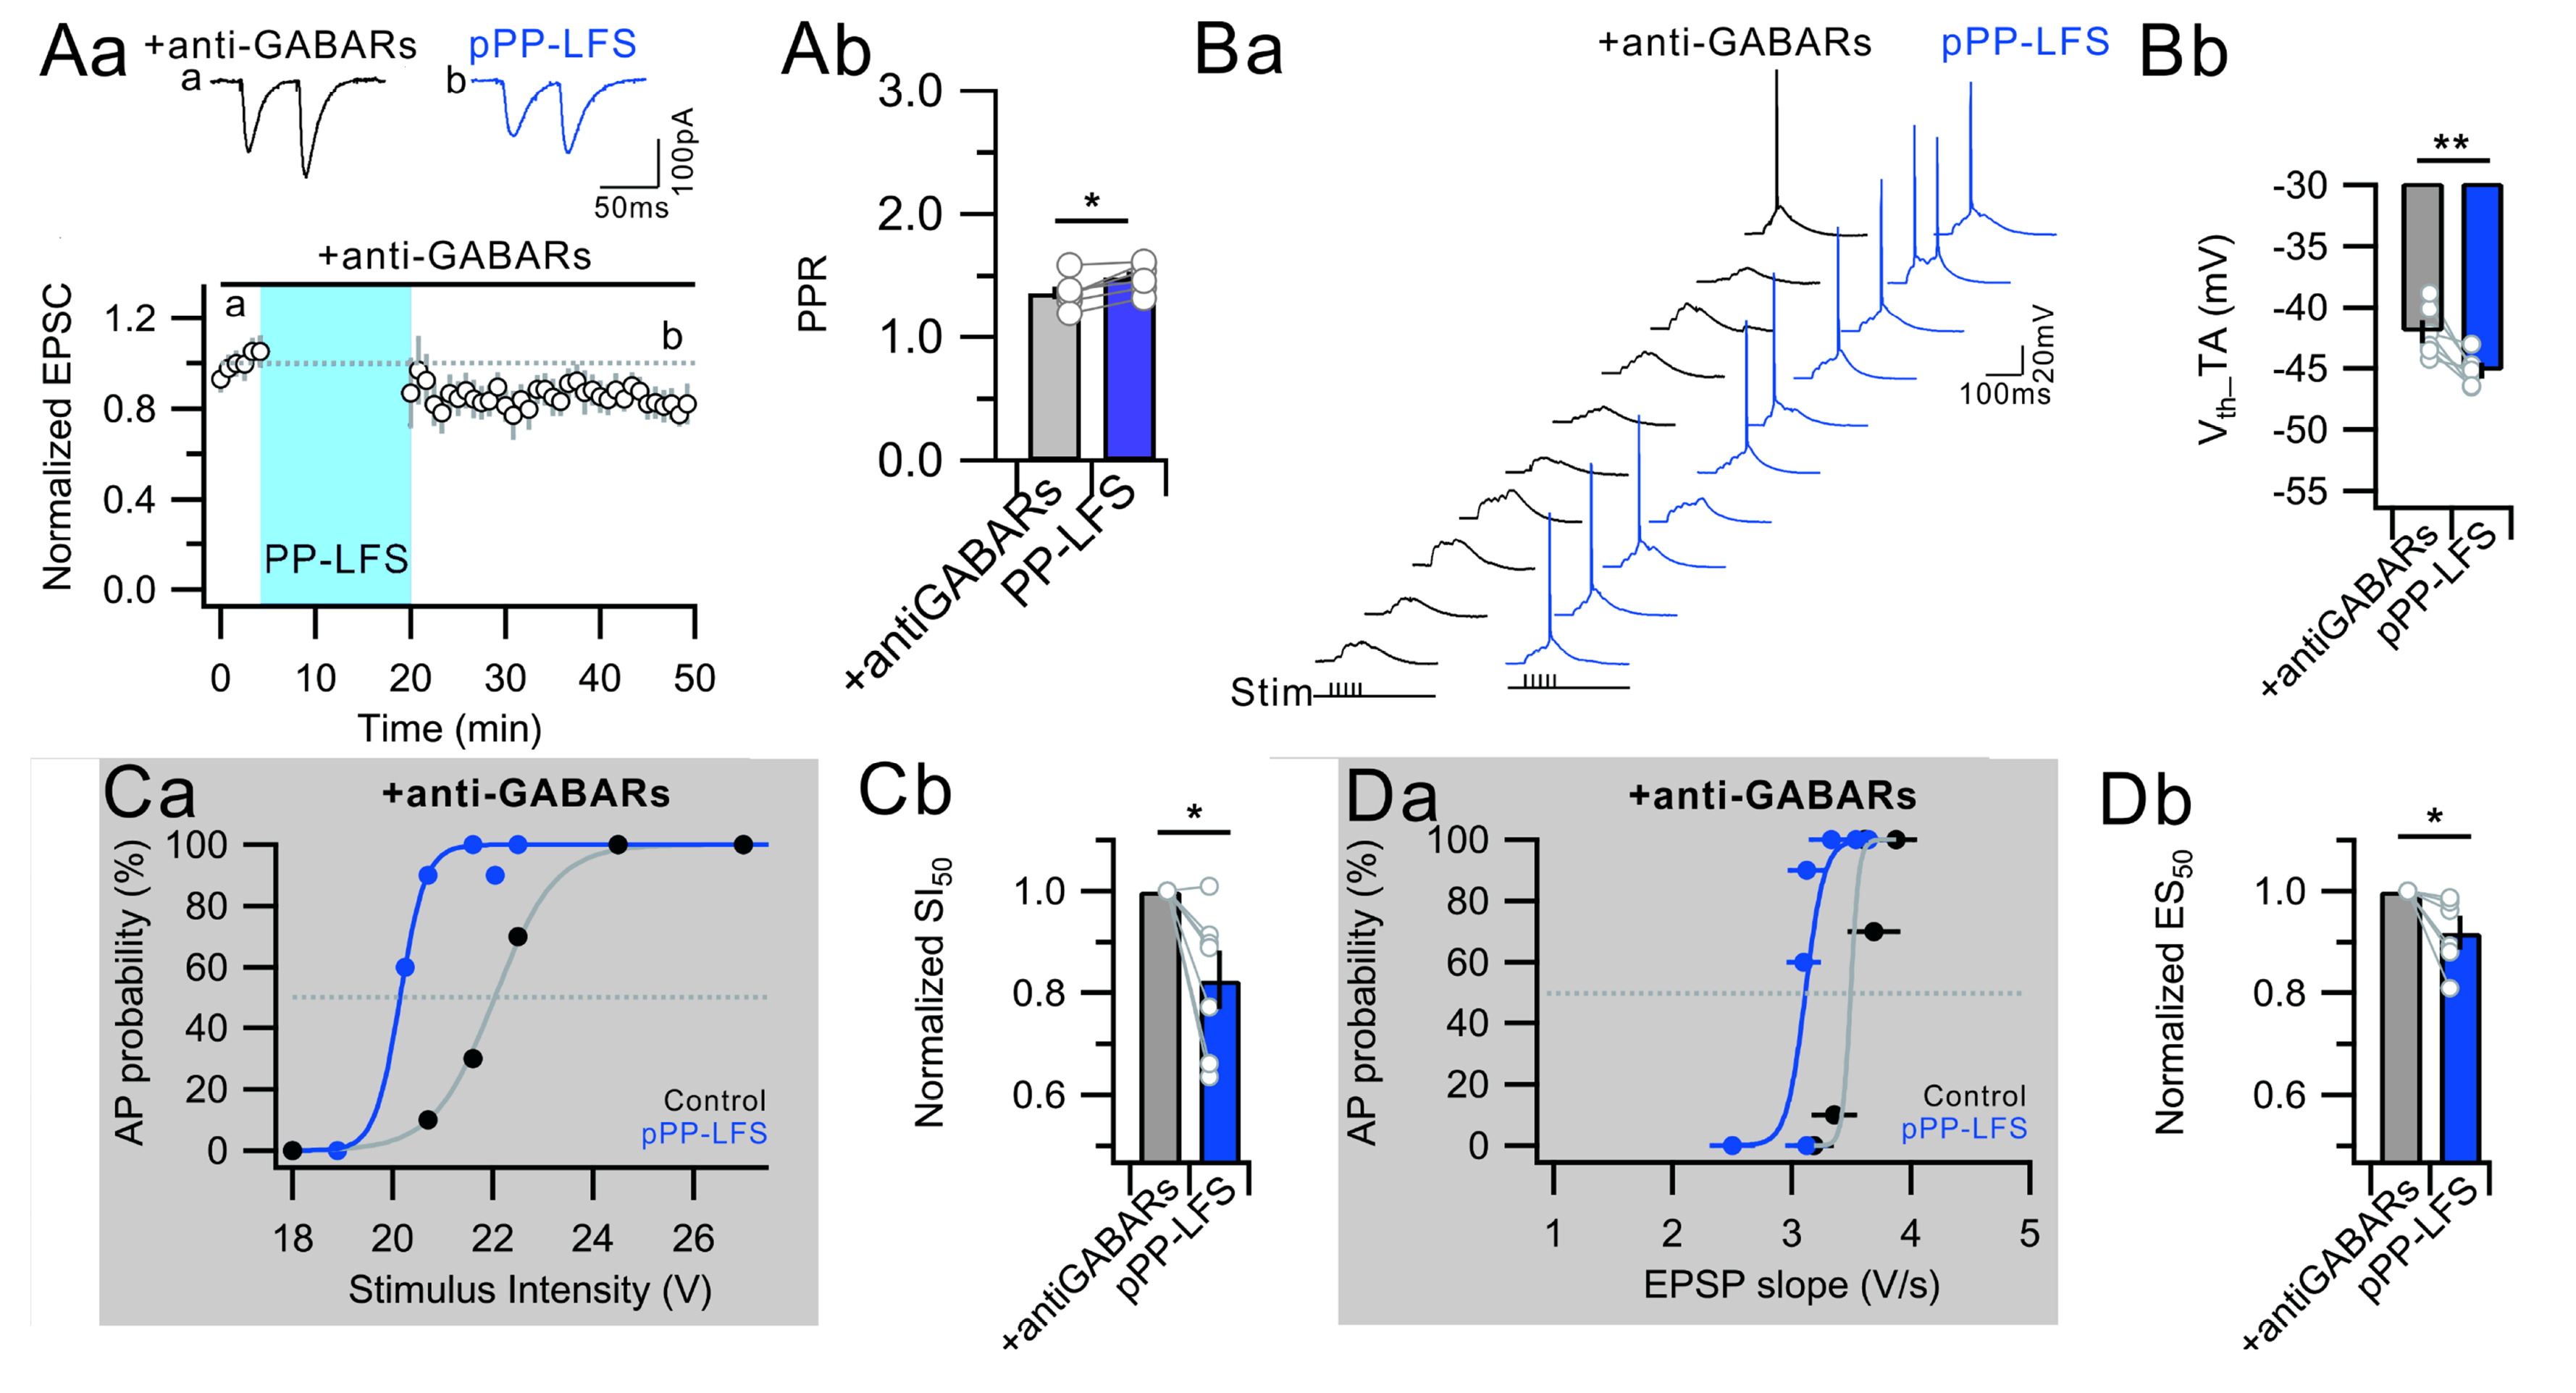
Fig. 2. The GABA
R blockers did not occlude the E-S potentiation associated with V
th hyperpolarization during the TA-LTD. (Aa) Application of the anti-GABARs did not abolish TA-LTD after the PP-LFS.
Insets: The representative EPSCs recorded before the PP-LFS induction (a, Control) and 25~30 min after the PP-LFS (b, pPP-LFS). (Ab) Change of PPR for the control and pPP-LFS under the presence of anti-GABARs. (Ba) Raw voltage traces as a result of 10 trials of TA burst stimulation (5 stimuli, 50 Hz, 2 s interval) for the control and the pPP-LFS. (Bb) Bar graphs representing significant V
th hyperpolarization that the AP induced by TA suprathreshold burst stimulation (V
th_TA). (Ca) Graph showing distribution of the AP probability as a function of stimulus voltage before for the control and the pPP-LFS. AP probability was obtained from 10 trials at each stimulus intensity. (Cb) Bar graphs and circles represent the average and individual normalized SI
50, respectively, which is significantly decreased after the PP-LFS. (Da) Graph showing the distribution of the firing probability as a function of the Max. EPSP slope (Control) and 30 min after the PP-LFS (pPP-LFS). The firing probability was obtained from 10 trials at each stimulus intensity. (Db) Bar graphs and circles represent the average and individual normalized ES
50, respectively. Error bars indicate the SEM. For the experiments of
Figure 2, 7 mice were used.