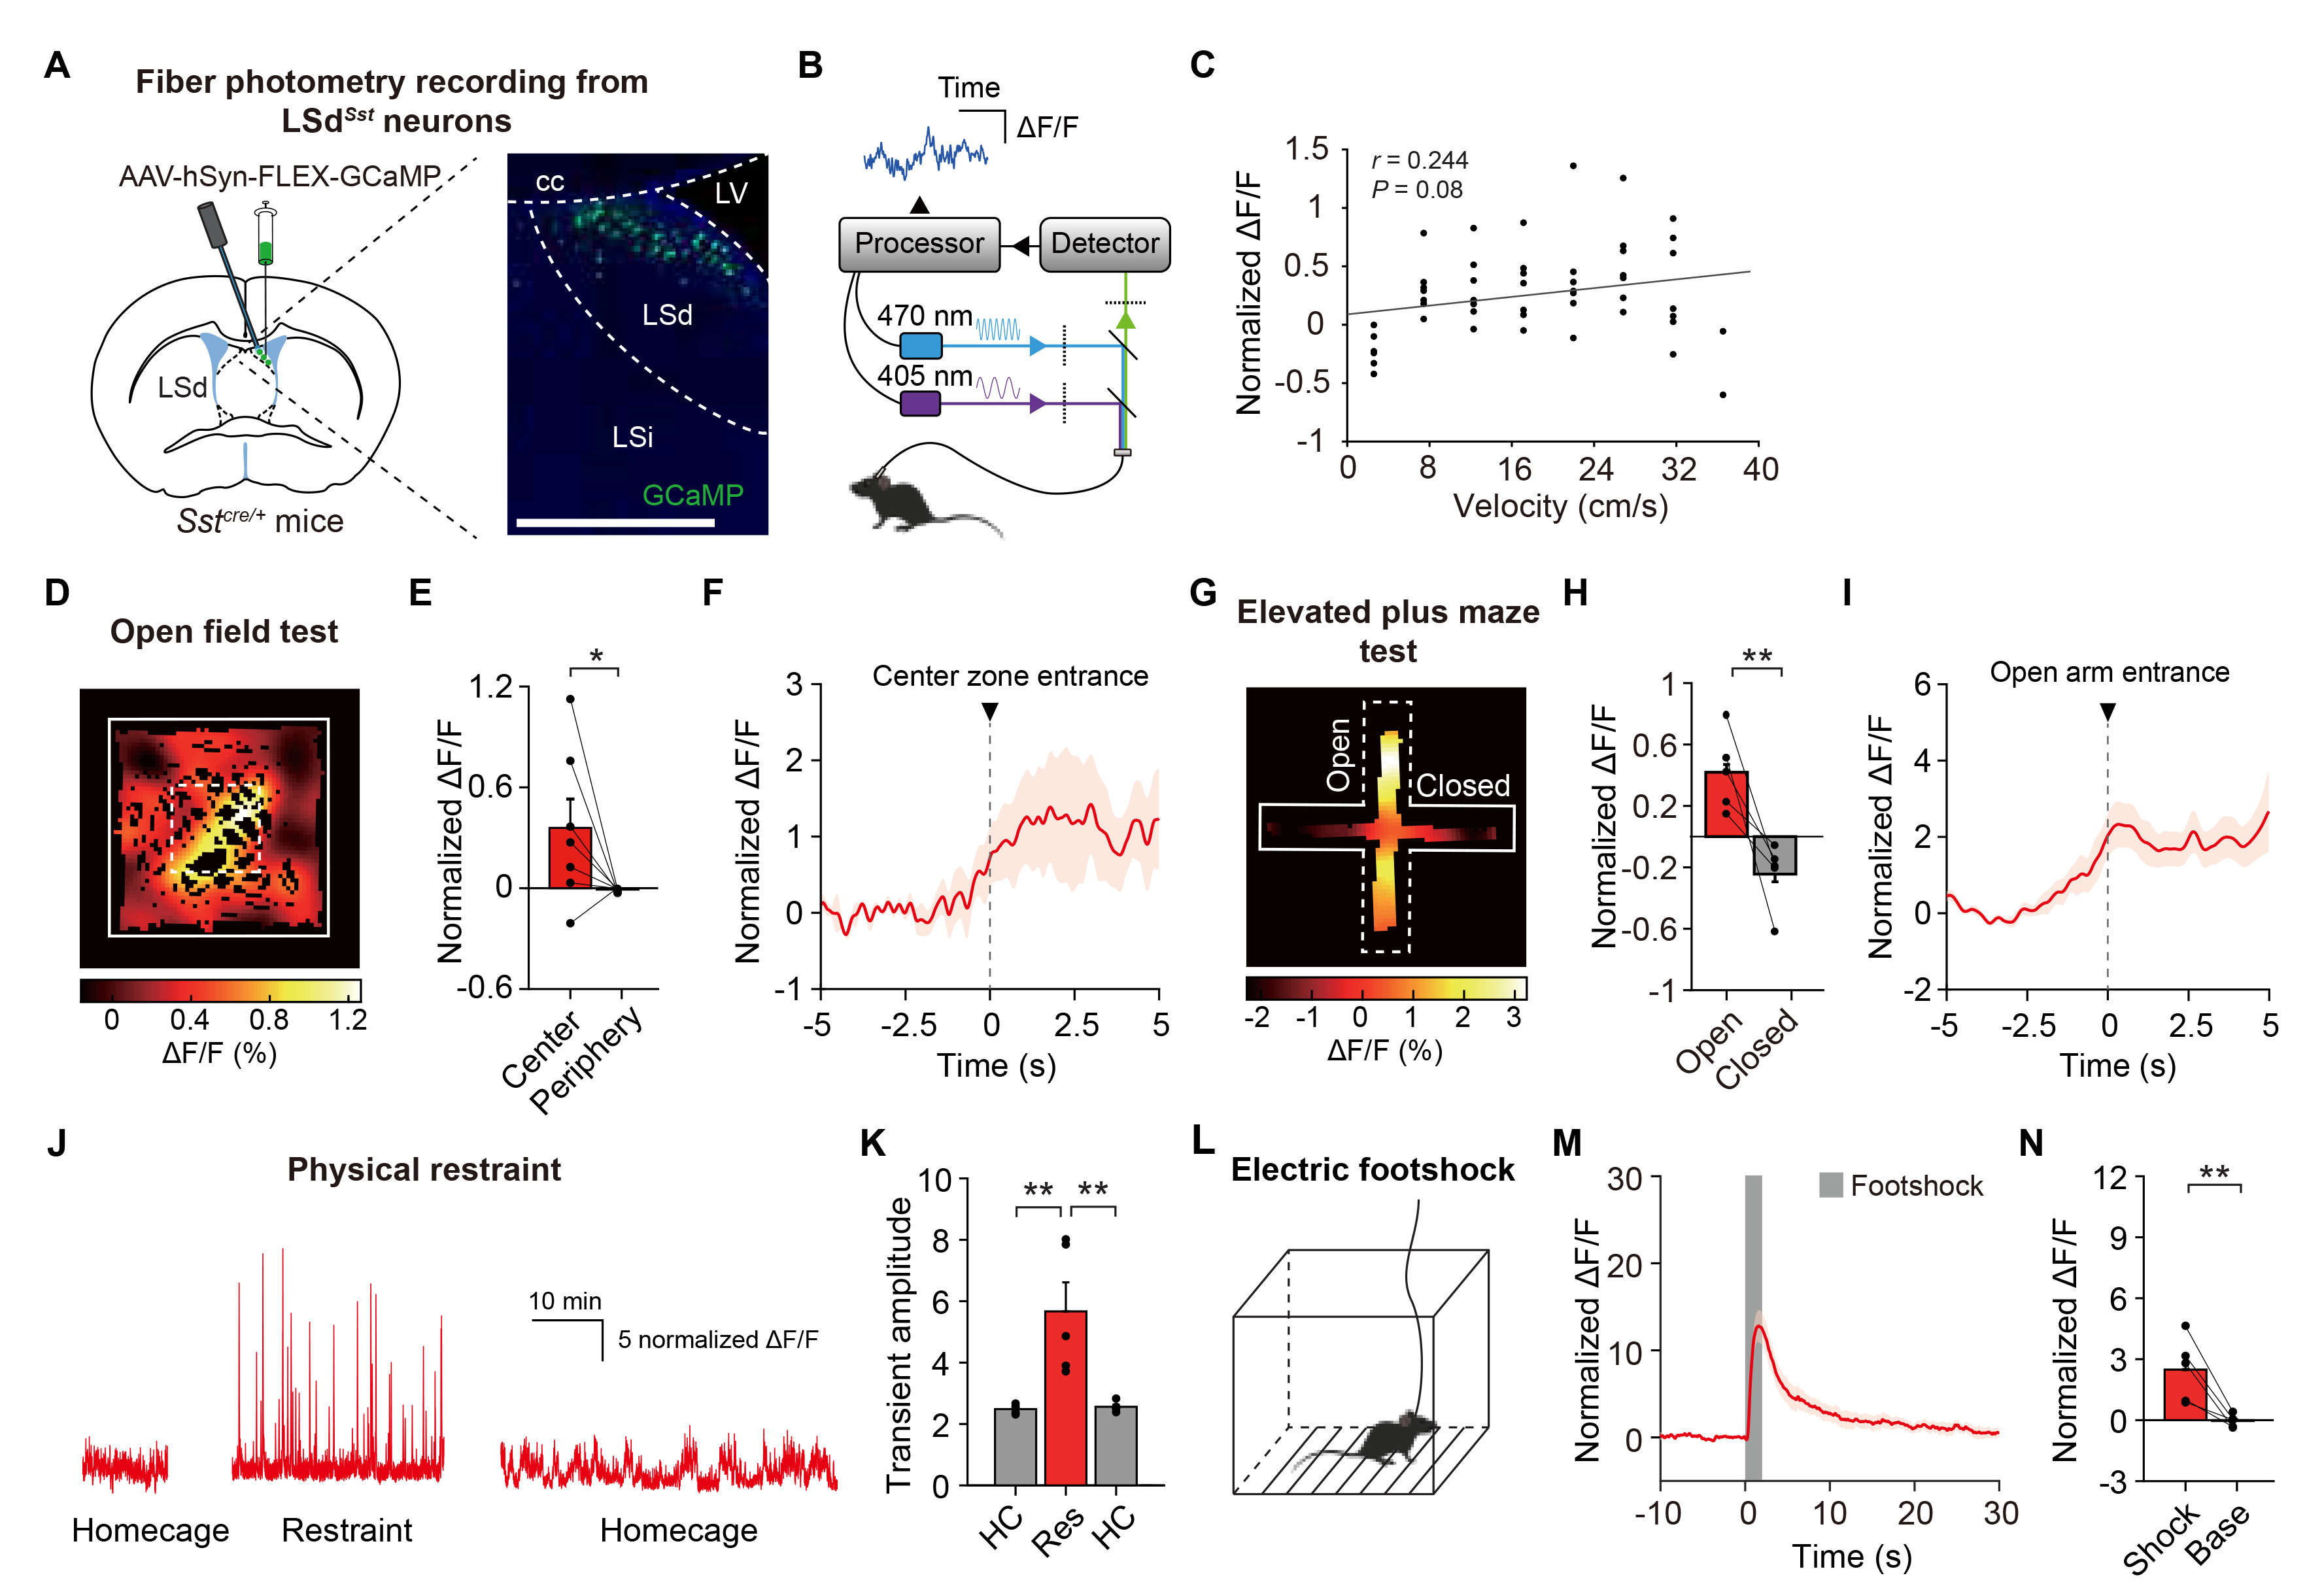
Fig. 1. LSdSst neurons are activated in response to diverse stressors. (A) Schematics showing Cre-dependent expression of GCaMP6 and fiberoptic cannula implantation for fiber photometry recordings from LSdSst neurons. Representative confocal images show LSd- restricted expression. Scale bar, 200 µm. (B) Schematic of the fiber photometry system. (C) Velocity of mice was only weakly correlated with the activity of LSdSst neurons (n=7, Pearson’s r=0.244, p=0.08). (D) Spatial calcium activity map of a representative mouse showing the higher activity of LSdSst neurons in the center zone of the open field arena. Average normalized calcium responses are color-coded for each pixel of spatial location. (E) Average calcium activity of LSdSst neurons in the center and the periphery (n=7, p=0.03). (F) Peri-event plot showing increases in the activity of LSdSst neurons as mice approach and enter the center zone. (G) Representative calcium response heatmap showing increased activity of LSdSst neurons in the open arms of the elevated plus maze. (H) Average calcium activity of LSdSst neurons for open arms (Open) was higher than for closed arms (Closed) (n=5, p=0.008). (I) Peri-event plot showing increases in the activity of LSdSst neurons as mice approach and enter open arms. (J) Representative traces showing increased activity of LSdSst neurons during the baselines and physical restraint. (K) Calcium transient amplitudes of LSdSst neurons were increased by restraint (n=5, one-way repeated measures ANOVA interaction, F(2,8)=19.65, p=0.0008). HC, homecage; Res, restraint. (L) Mice were given a series of electric footshocks. (M) Average calcium transients around the shock show time-locked responses of LSdSst neurons (n=5). Shaded box, footshock. (N) Average normalized calcium responses of both LSdSst neurons to shock delivery (Shock, 0~2 s from the shock onset) were larger than activity level during rest of the session (Base) (n=5, p=0.008). Data are represented as mean±s.e.m. Asterisks indicate significance levels for comparisons in each panel using Bonferroni post-tests following one-way repeated measures ANOVA or Wilcoxon rank-sum test (*p<0.05, **p<0.01).
© Exp Neurobiol