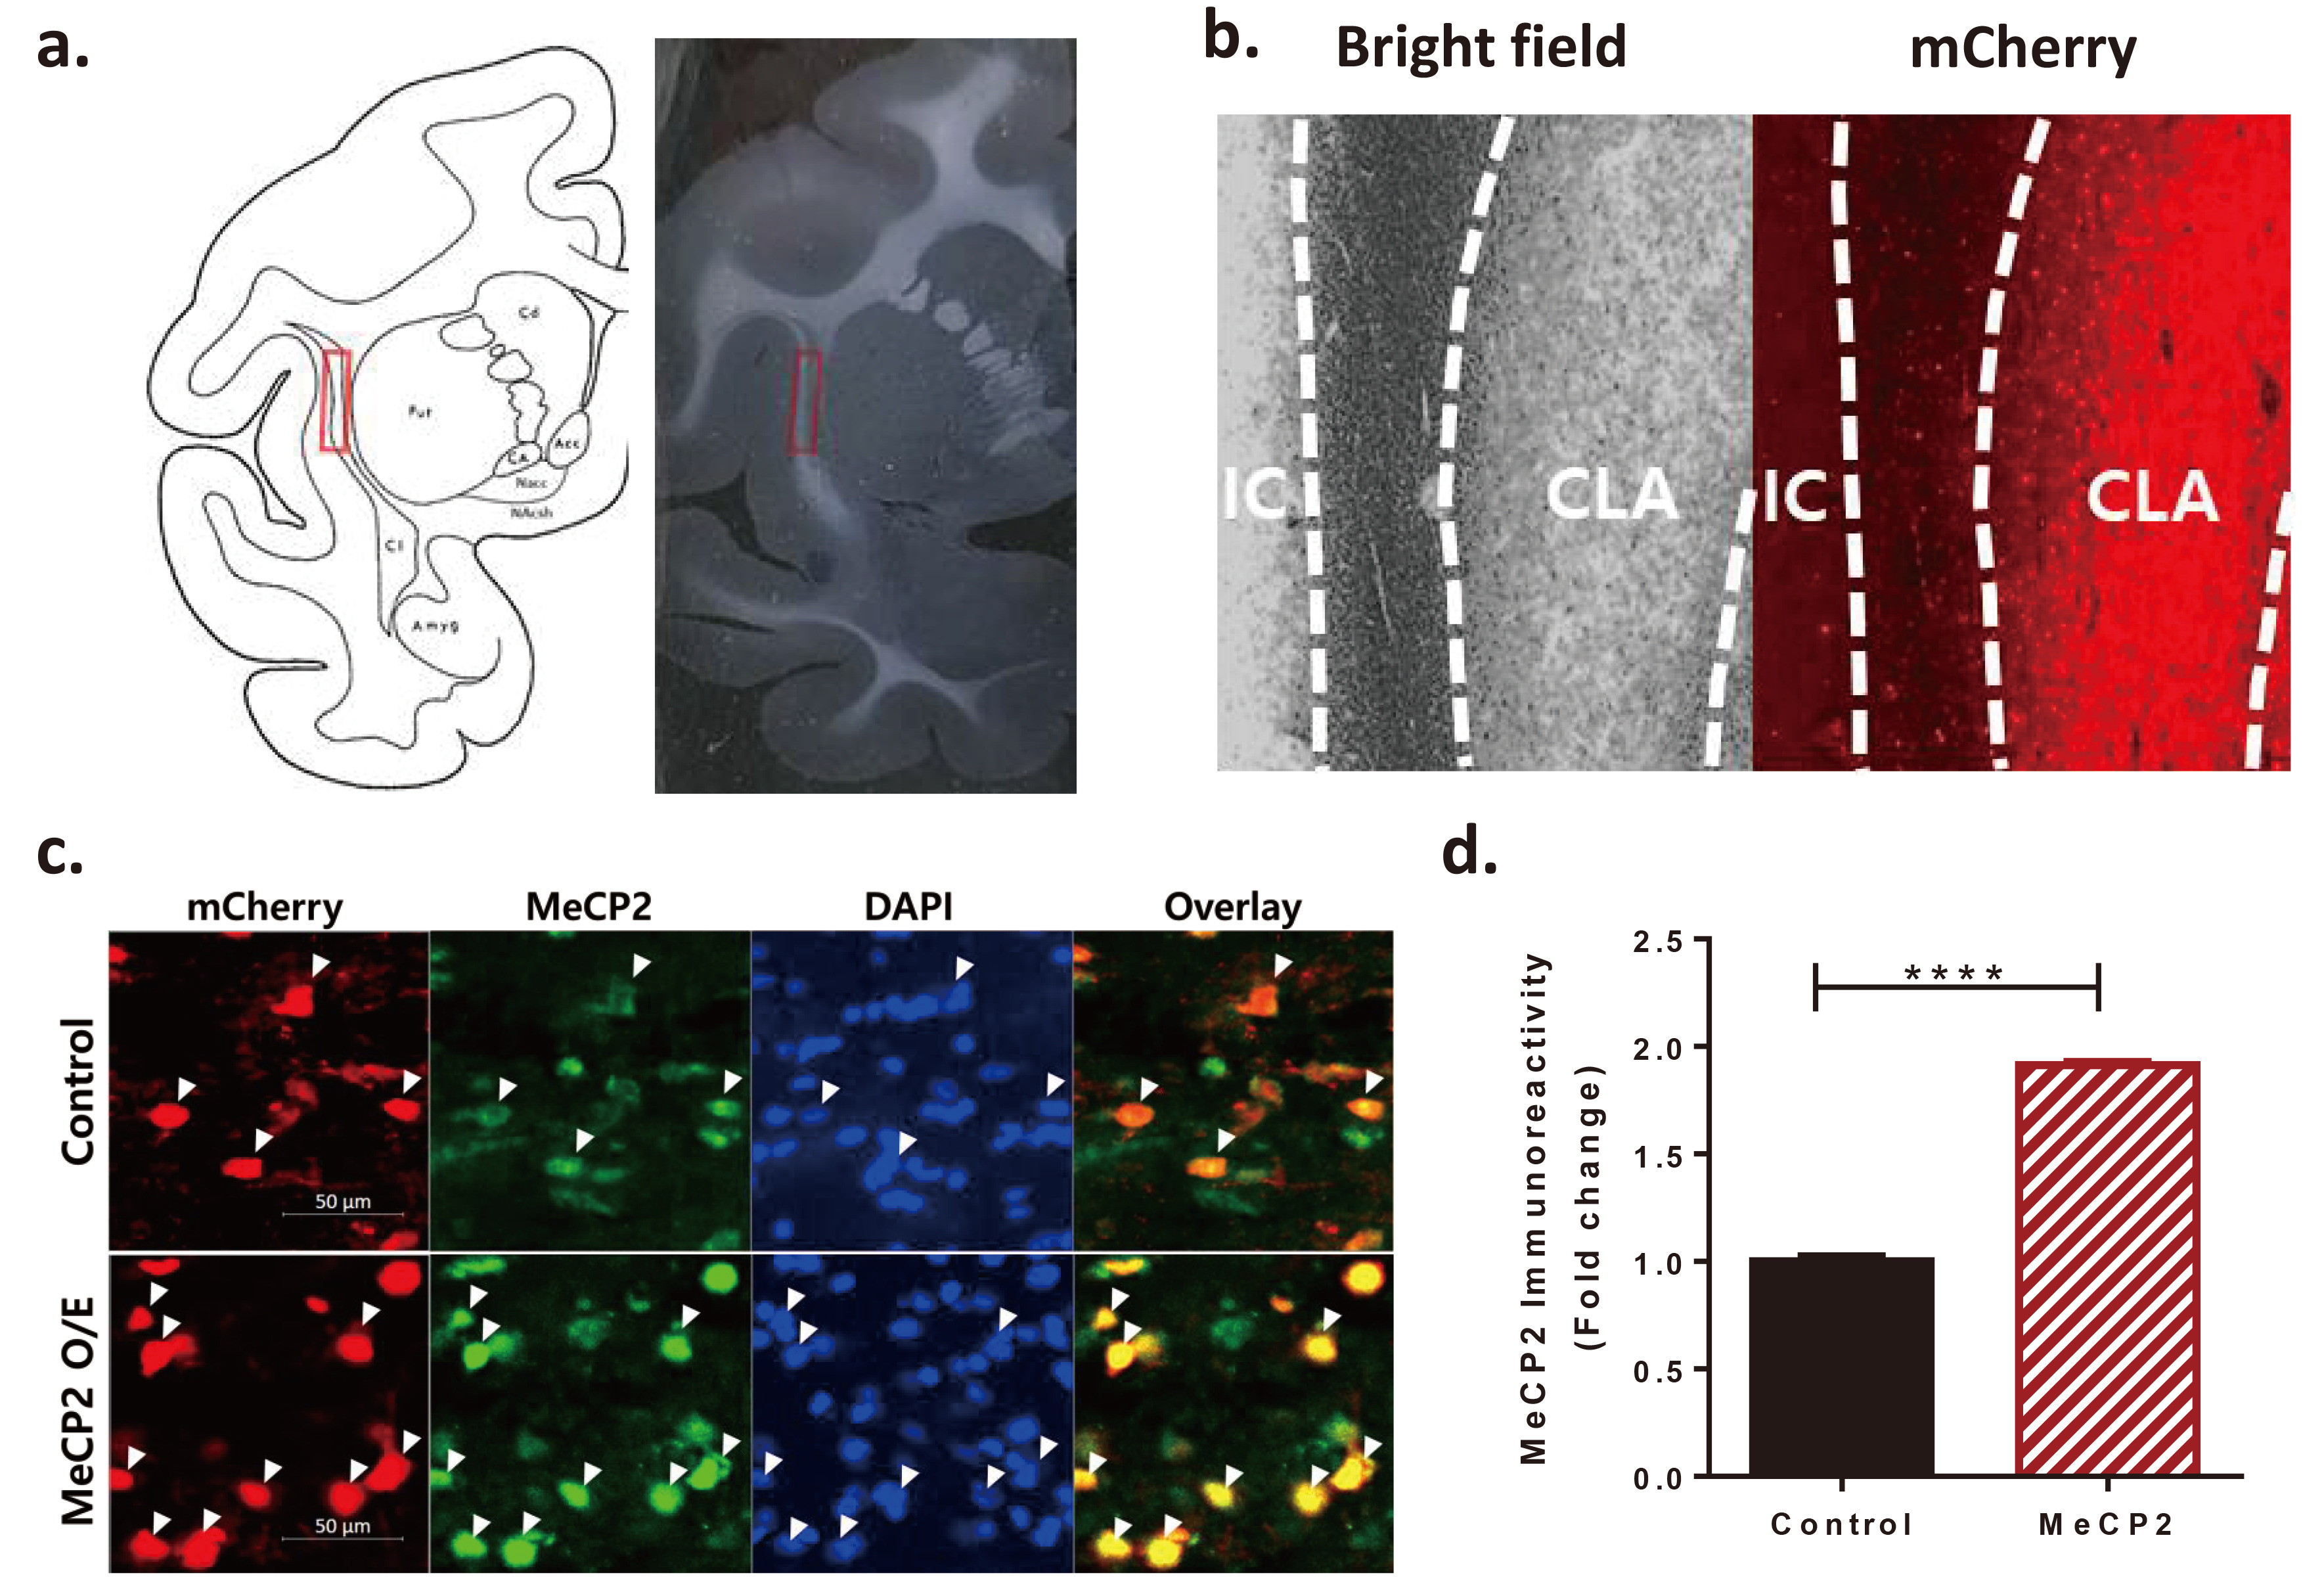
Fig. 2. The expression of hMeCP2 in the claustrum. (a) The site where the virus was injected in the claustrum of a cynomolgus monkey (anteroposterior (AP): +19 mm, ±13.5 mm mediolateral (ML), and -16 mm dorsoventral (DV)) is indicated in the red box. (b) Confirmation of injected location in the claustrum, IC: Insula cortex, CLA: claustrum (left: bright field, right: mCherry). (c) Representative immunoreactivity in the claustrum in the control and MeCP2 expressed groups, 50 um (red: mCherry, green: MeCP2, blue: DAPI). Arrows correspond to representative co-localizations of MeCP2 and mCherry immunoreactivity with DAPI staining. (d) Densitometry analysis of MeCP2 immunoreactivity in the control group [30 cells/ 2 cases] and MeCP2 expression group [30 cells/2 cases].
© Exp Neurobiol