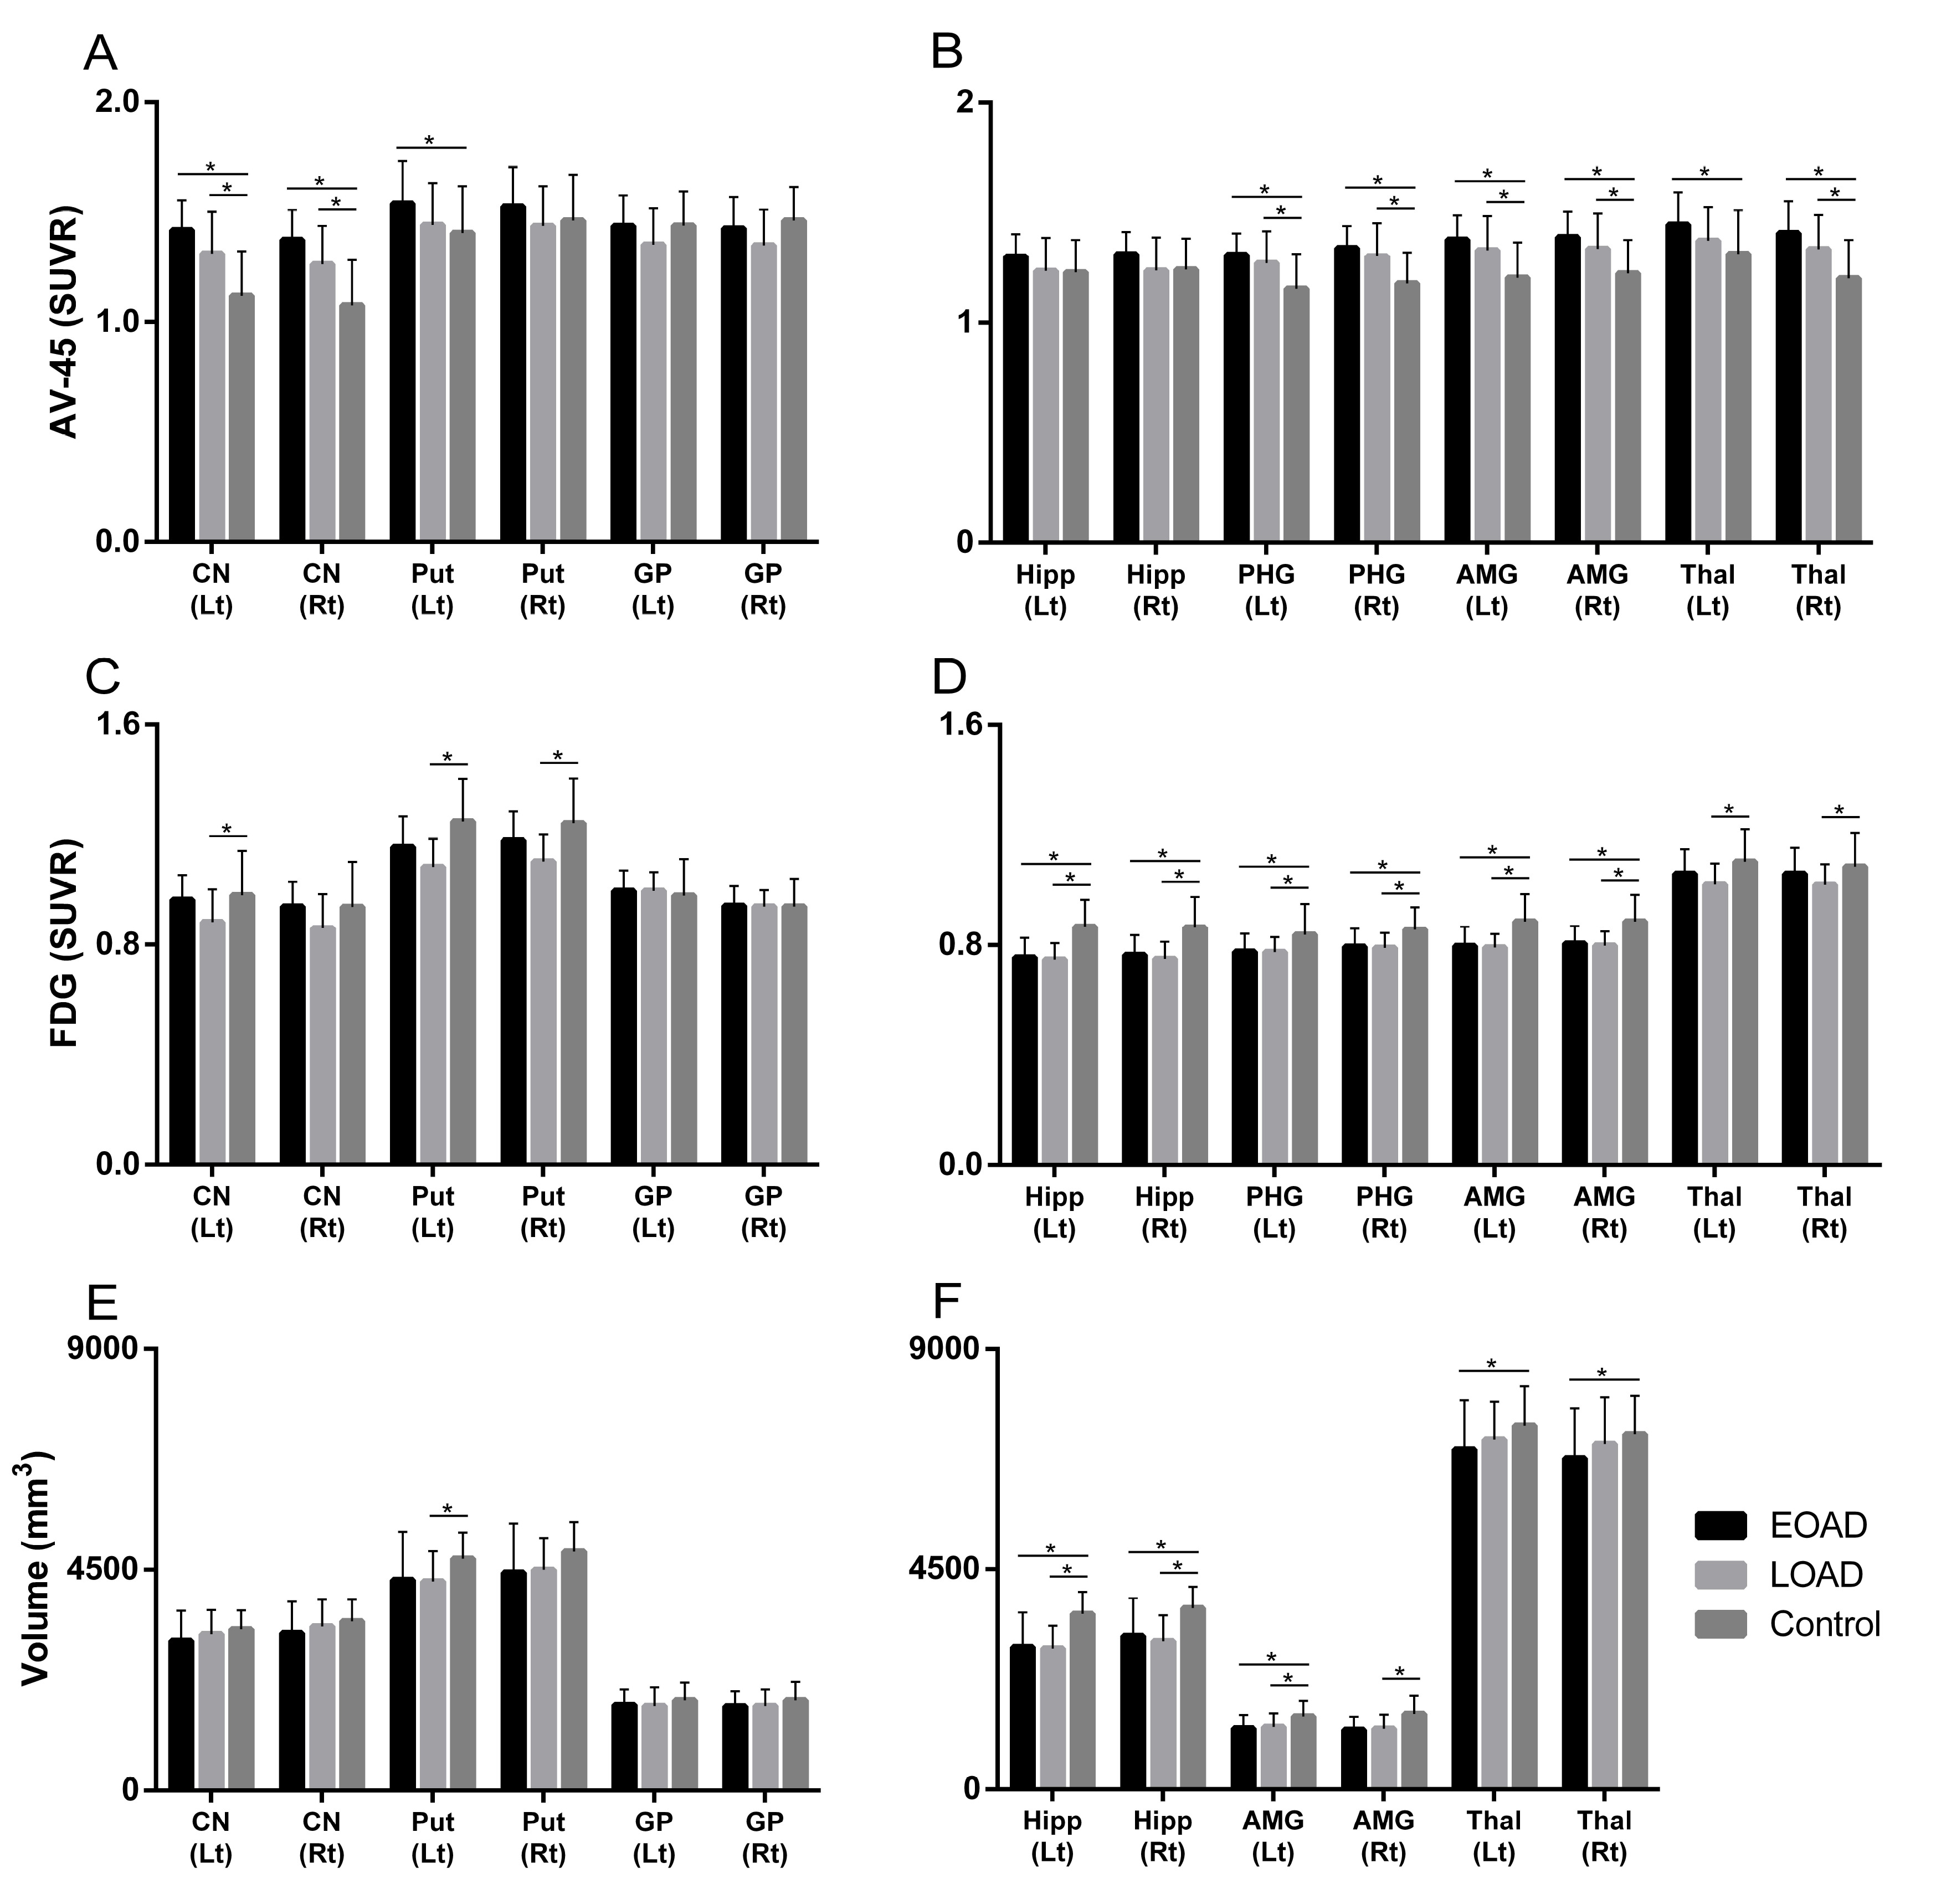
Fig. 1. Functional and structural changes in the striatum. (A, B) Amyloid uptake. The EOAD group showed a greater degree of amyloid uptake in the striatum (A) and other subcortical structures (B) compared to the LOAD group. (C, D) Glucose metabolism. Glucose metabolism was more preserved in the EOAD group in the striatum (C) and thalamus (D) compared to the LOAD group. (E, F) Volume changes. Volume change was not significant in the striatum (E) but noted in the thalamus (F) in the EOAD group compared to the LOAD group. CN, Caudate nucleus; Put, Putamen; GP, Globus pallidus; Hipp, Hippocampus; PHG, Parahippocampal gyrus; AMG, Amygdala; Thal, Thalamus; SUVR, a standardized uptake value ratio.
© Exp Neurobiol