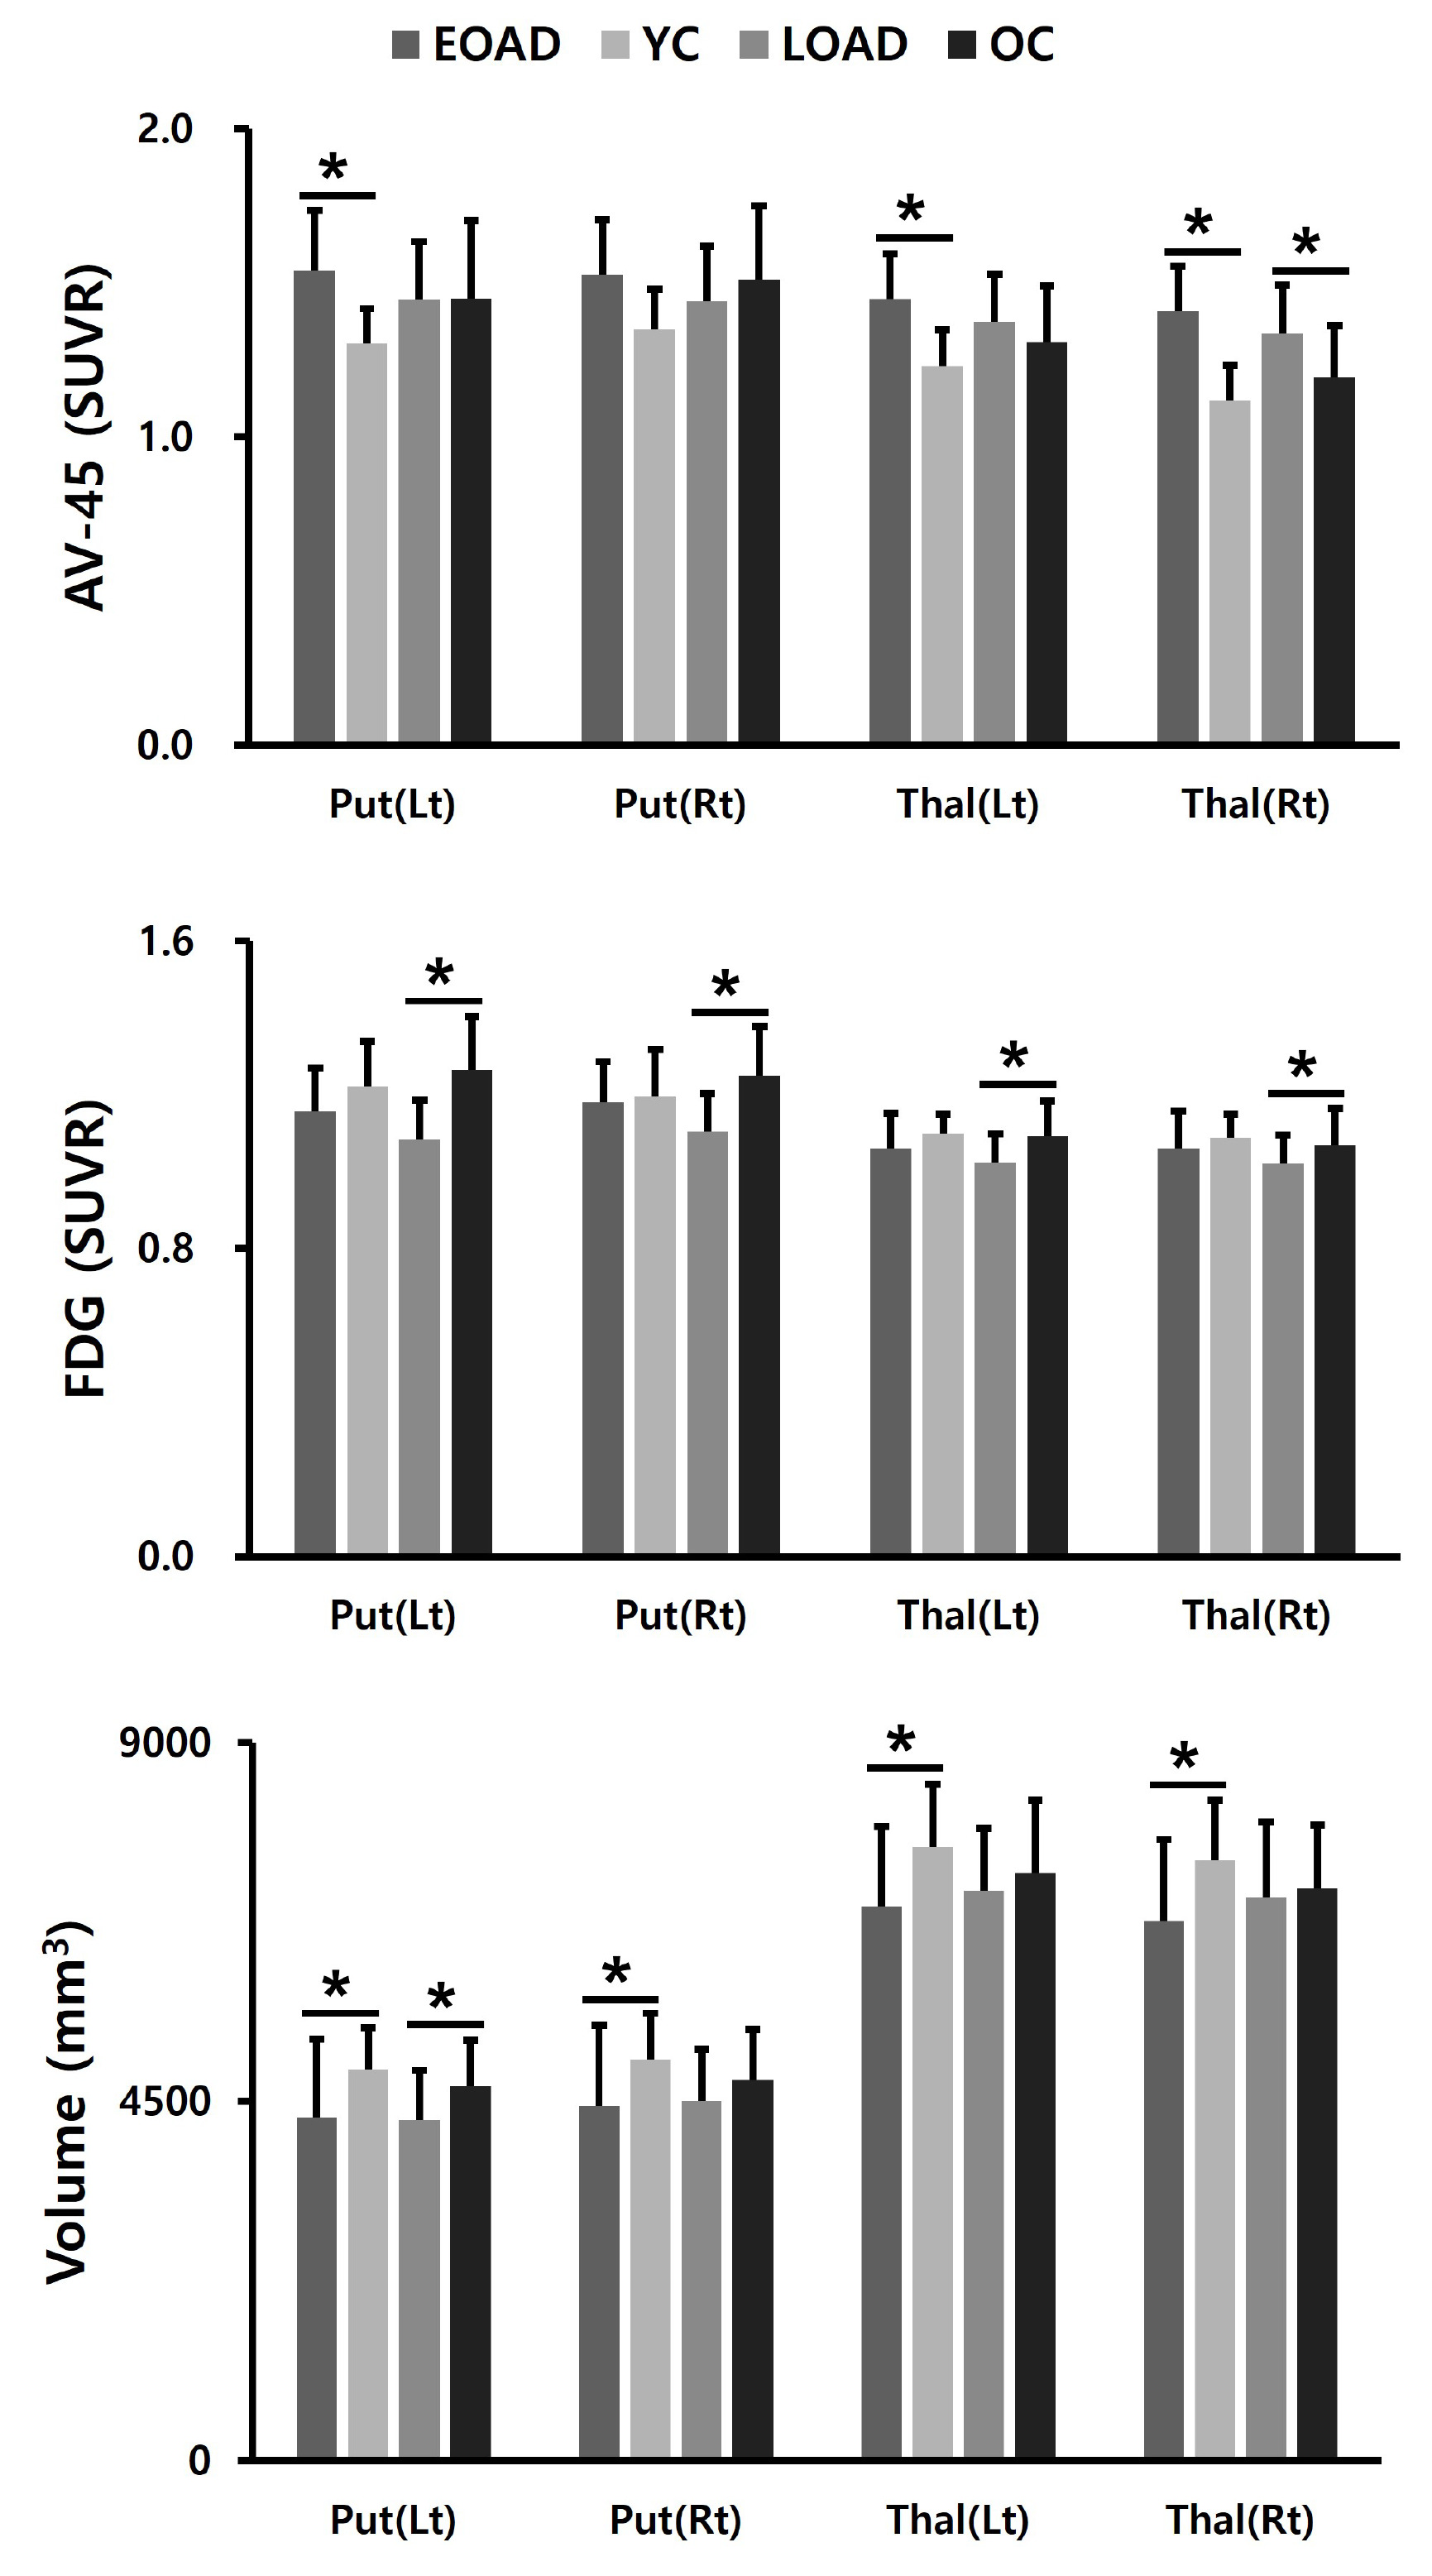
Fig. 2. Functional and structural imaging changes in the putamen and thalamus compared to young and old normal control groups. (A) The EOAD group showed a greater degree of amyloid uptake in the left putamen and both thalamus compared to the young control group (YC). (B) Glucose hypometabolism was not noted both in the putamen and thalamus of EOAD patients compared to YC subjects. (C) Volume reduction was noted both in the striatum and thalamus of EOAD patients compared to YC subjects. Put, Putamen; Thal, Thalamus; SUVR, a standardized uptake value ratio.
© Exp Neurobiol