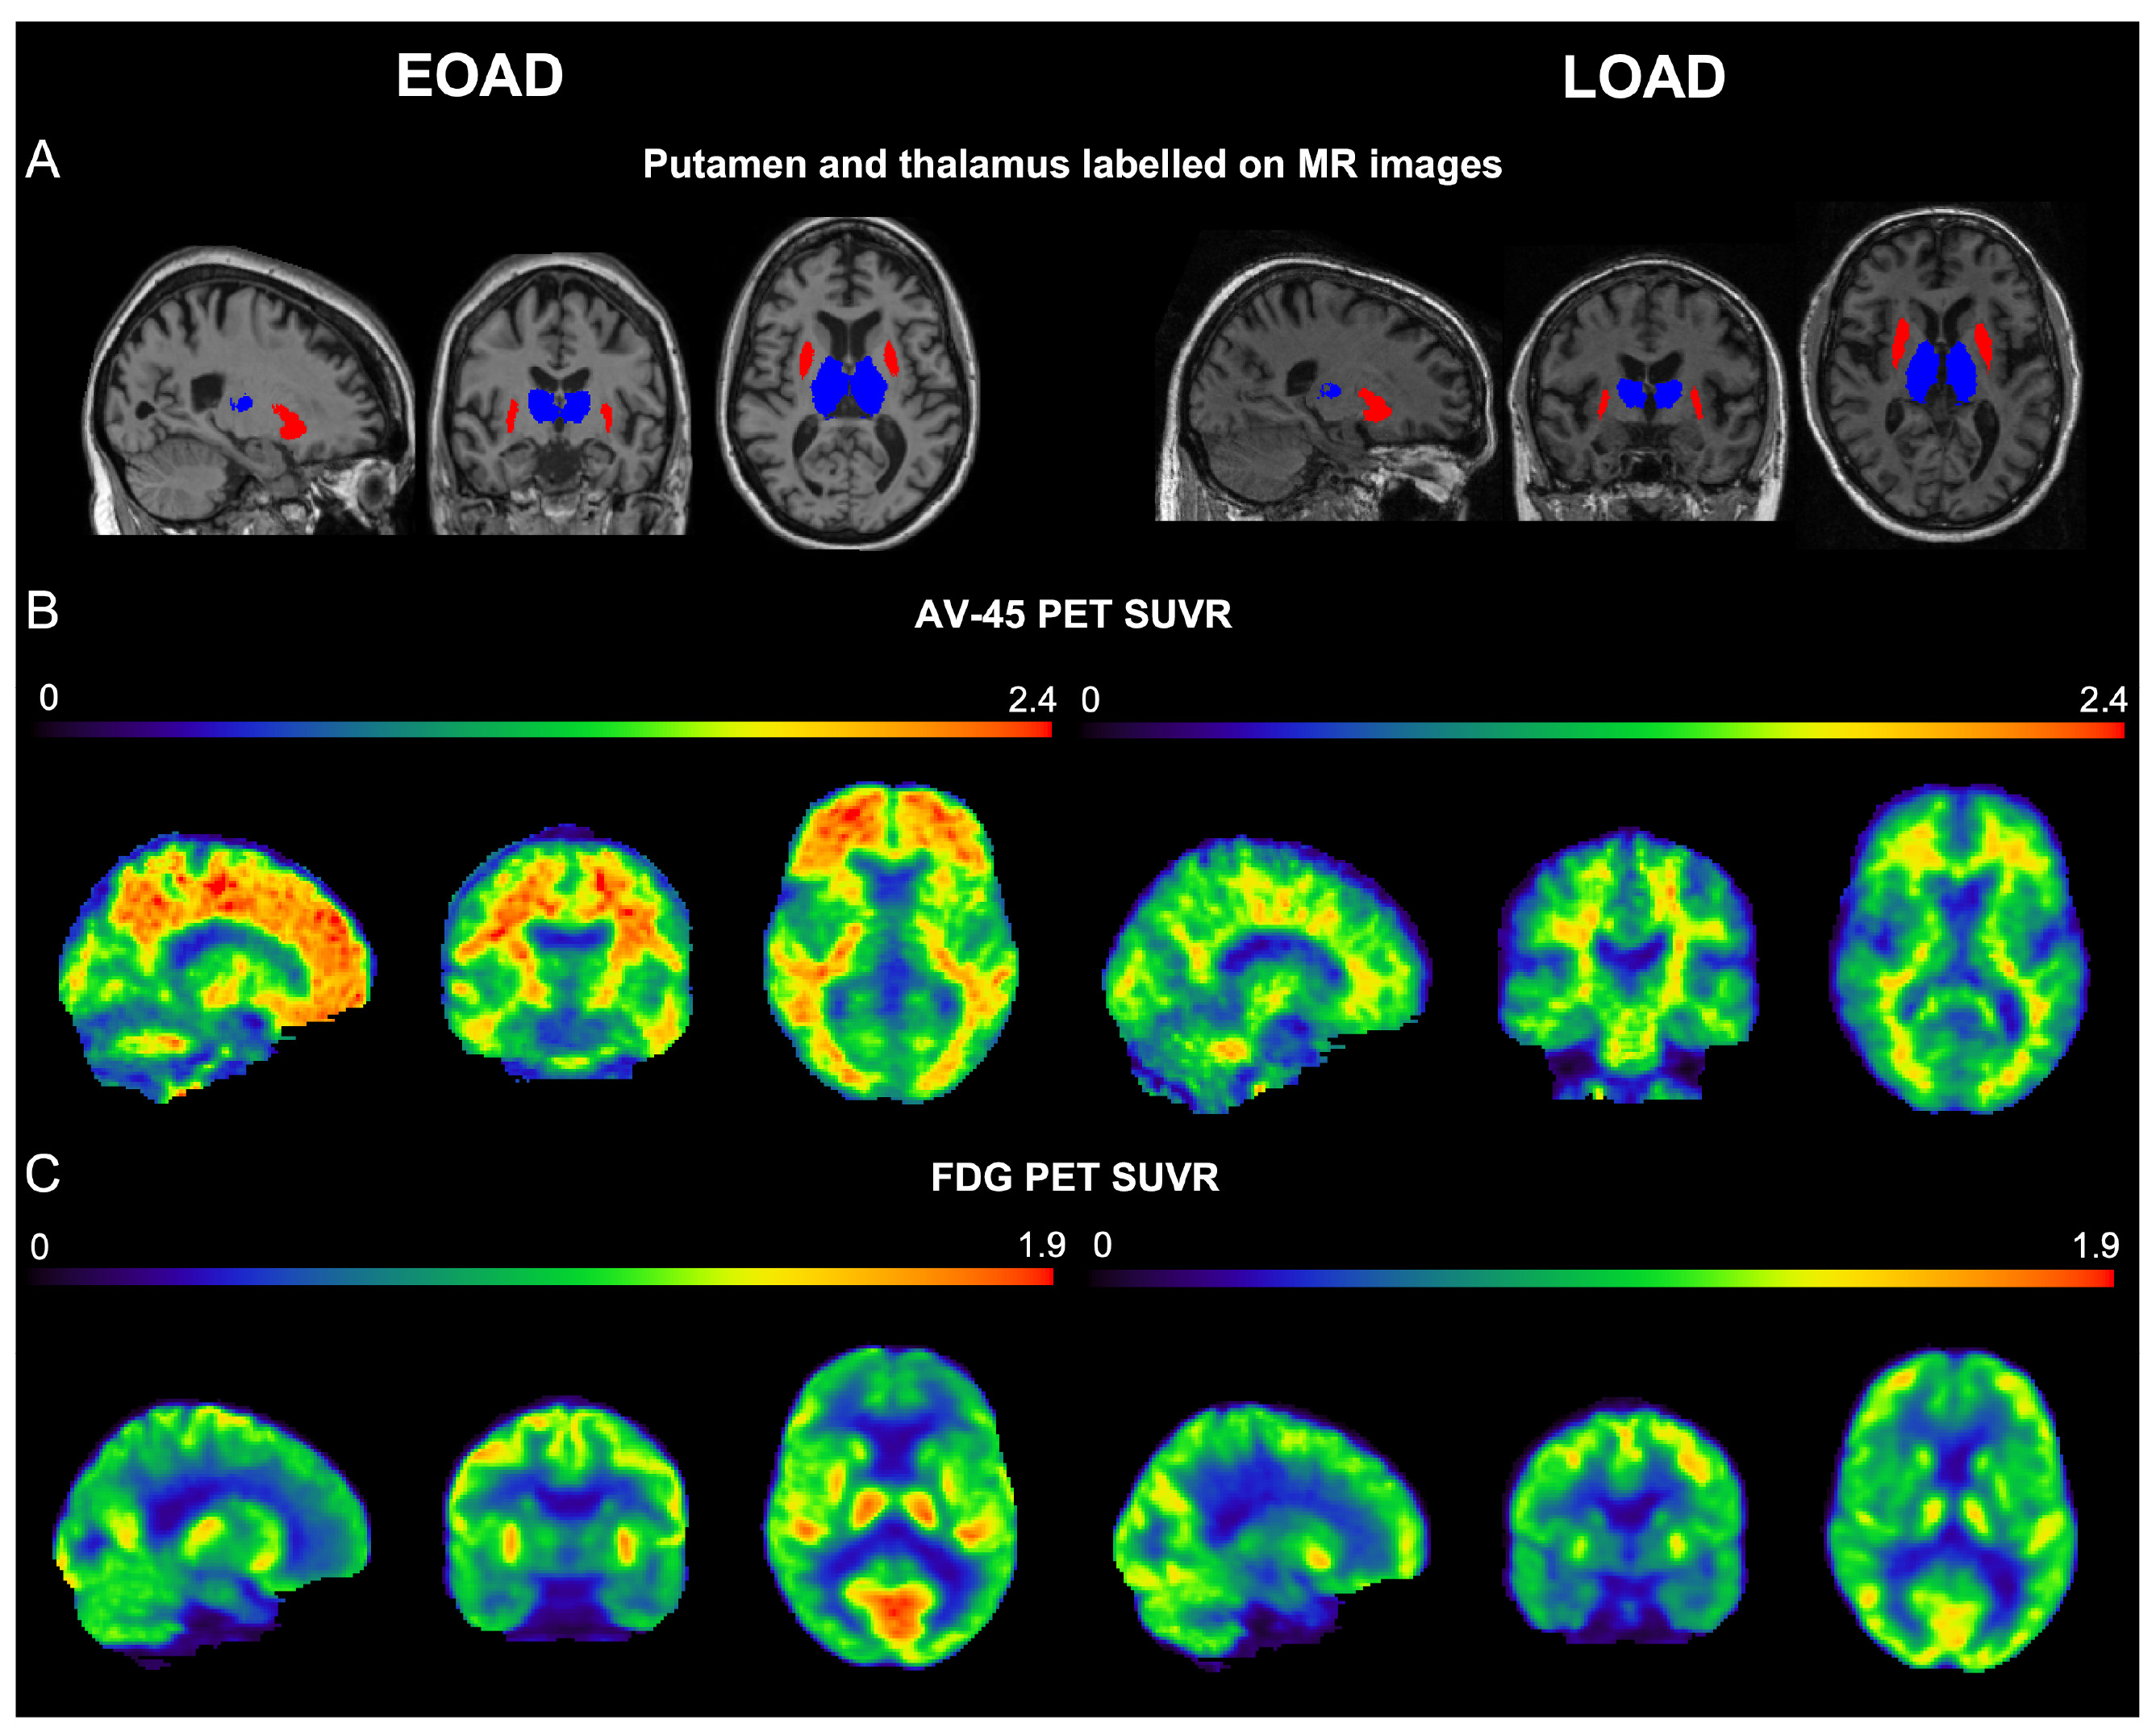
Fig. 3. PET images of the representative patients with EOAD and LOAD. (A) Thalamus (blue) and putamen (red) labelled on MR T1 images implemented on MNI template. (B) AV-45 PET images showed increased SUVR in the striatum and thalamus in EOAD compared to LOAD. (C) FDG-PET images showed maintained glucose metabolism in the putamen and thalamus in EOAD compared to LOAD. SUVR, a standardized uptake value ratio.
© Exp Neurobiol