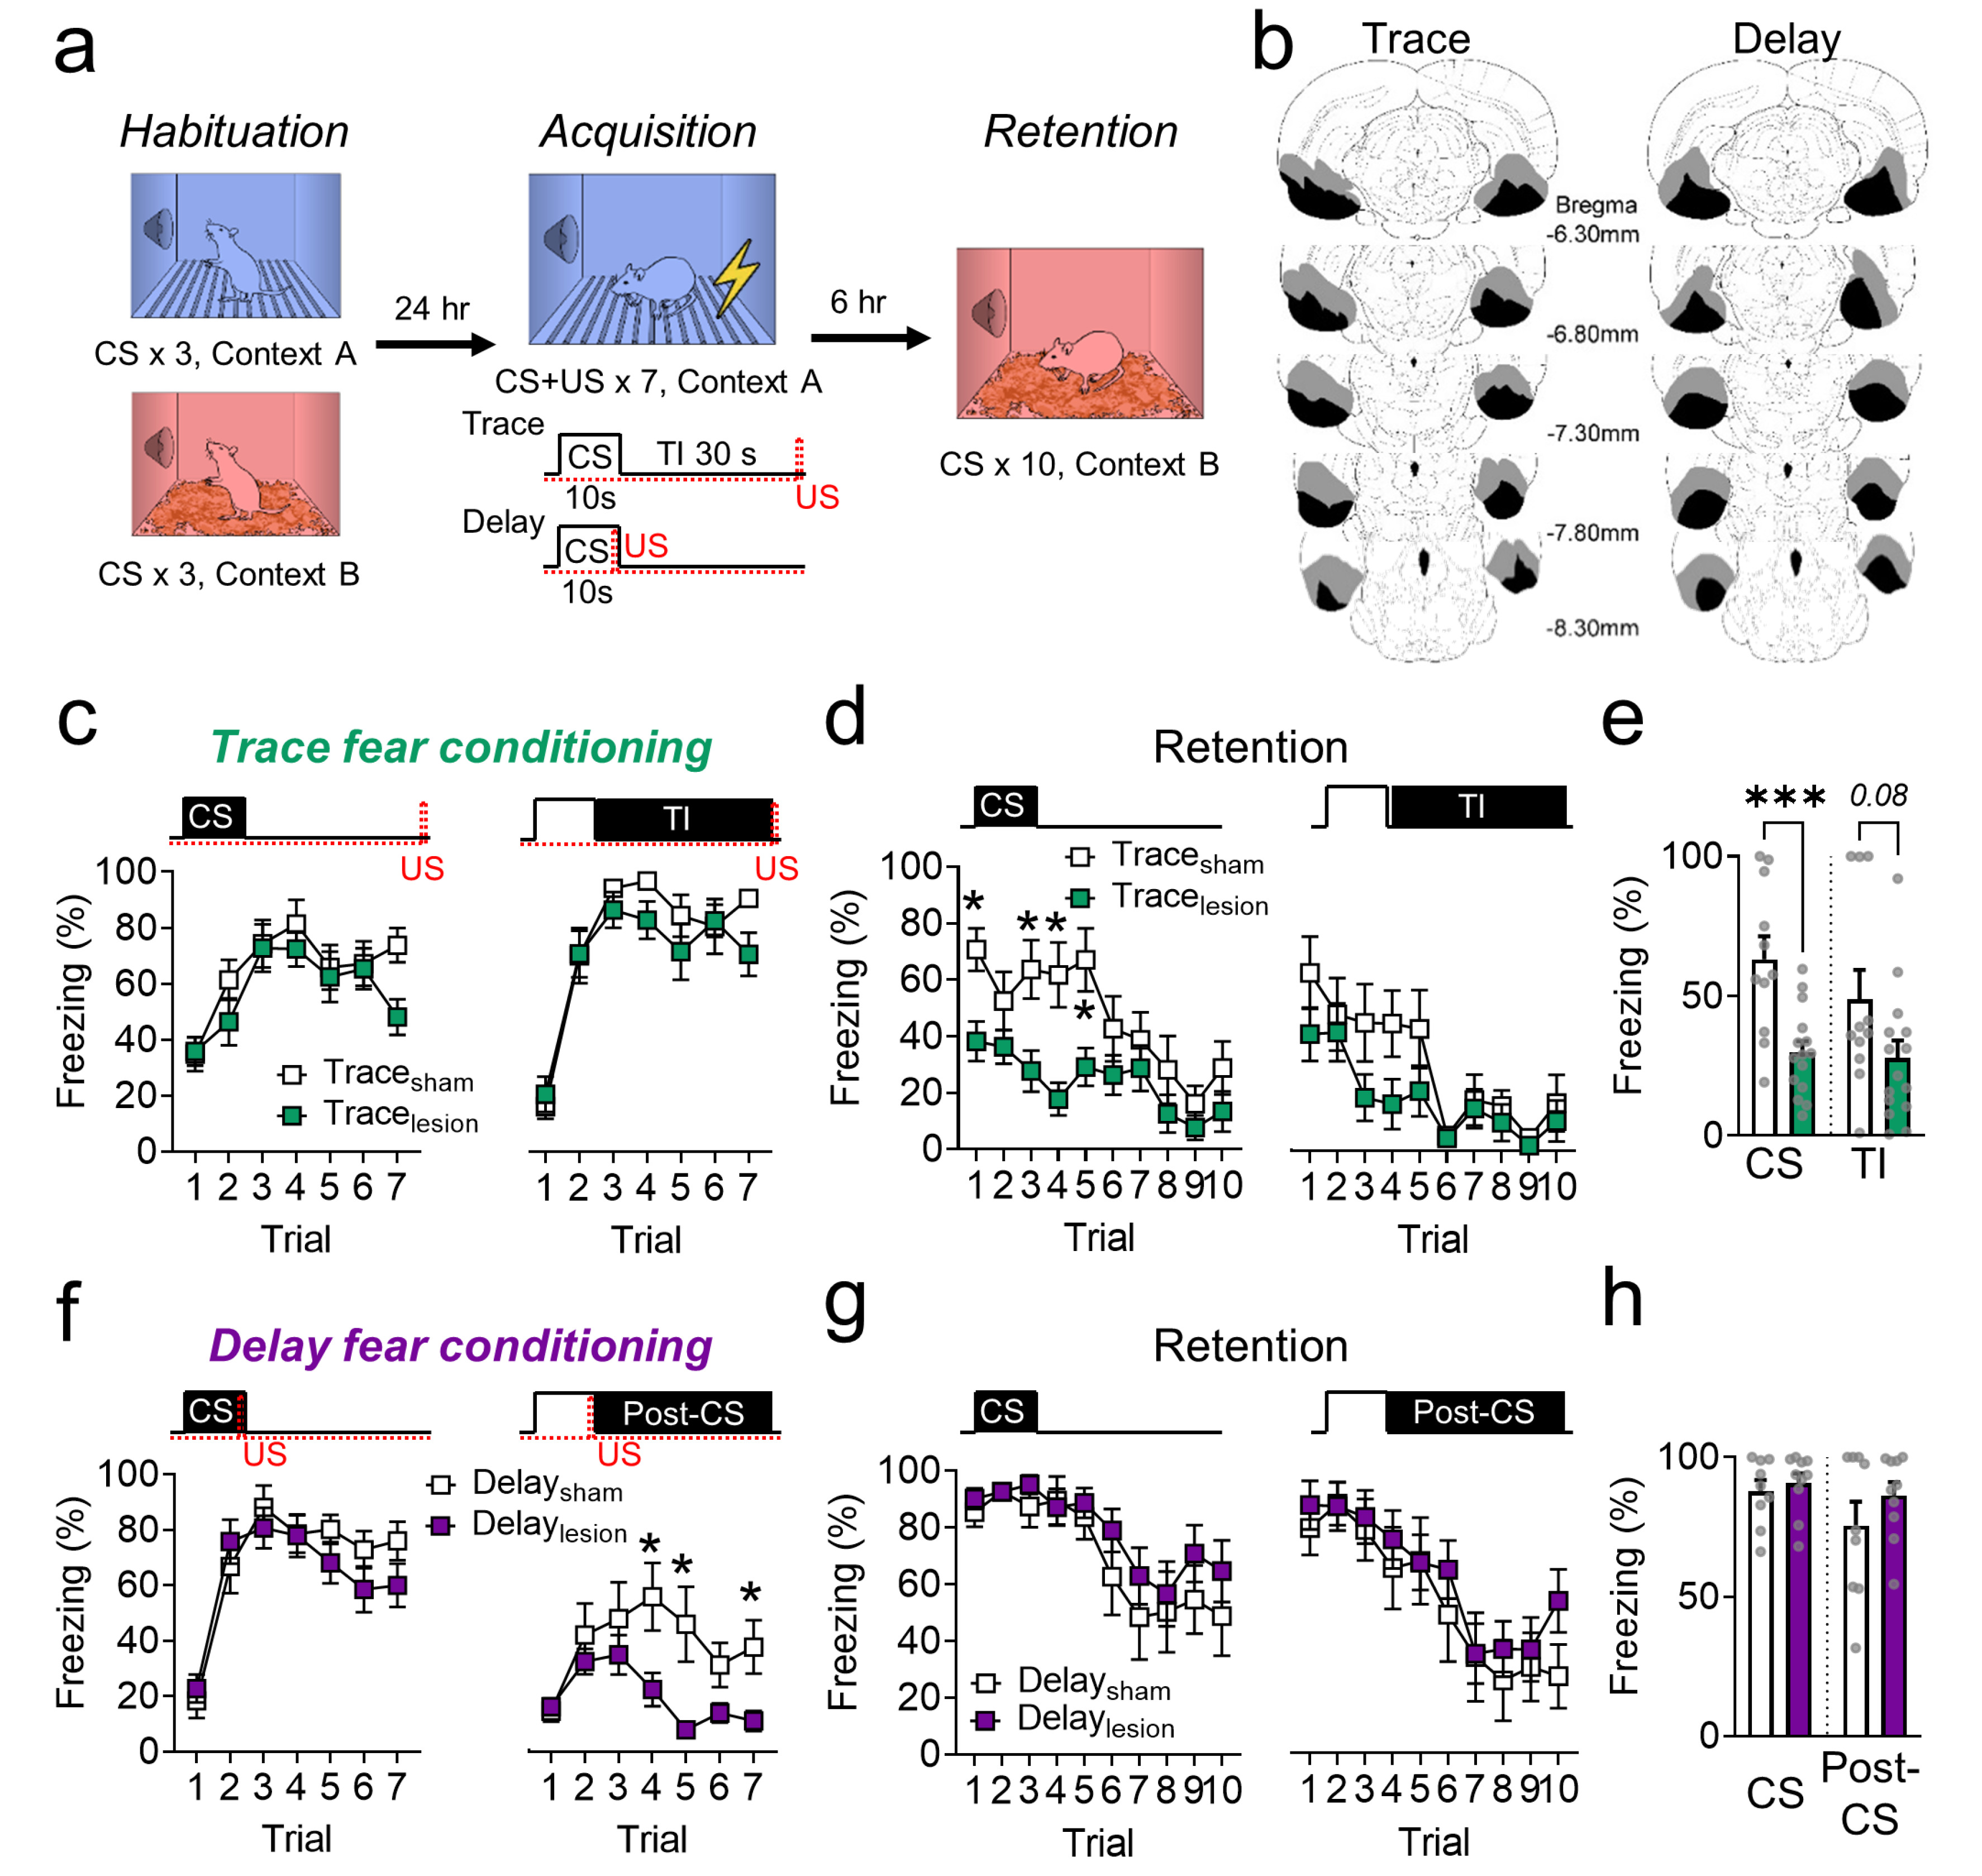
Fig. 1. C lesion on trace vs. delay fear conditioning in Exp. 1. (a) Behavioral procedures for trace and delay fear conditioning. (b) Histological reconstructions of the lesion sites in the EC (black, the smallest lesions; grey, the largest lesions). (c-e) The effects of bilateral EC lesion on trace fear conditioning. (c) Differences in freezing responses to the CS (left) and TI (right) between Tracesham (n=11, white square) and Tracelesion (n=15, green square) during the acquisition session (7 trials). (d) Differences in freezing responses to the CS (left) and TI (right) during the retention session (10 trials). (e) The mean freezing level of the first five trials during the retention session of trace fear conditioning. (f~h) The effects of bilateral EC lesion on delay fear conditioning. (f) Differences in freezing responses to the CS (left) and post-CS (right) between Delaysham (n=9, white square) and Delaylesion (n=10, purple square) during the acquisition session. (g) Differences in freezing responses to the CS (left) and post-CS (right) during the retention session. (h) The mean freezing level of the first five trials during the retention session of delay fear conditioning. Data for c, d, f, and g were assessed by a repeated measures of ANOVA followed by Bonferroni post-hoc test (*p<0.05), and data for e and h were assessed by independent t-test (***p<0.01). All data are represented as mean±standard error of the mean (SEM).
© Exp Neurobiol