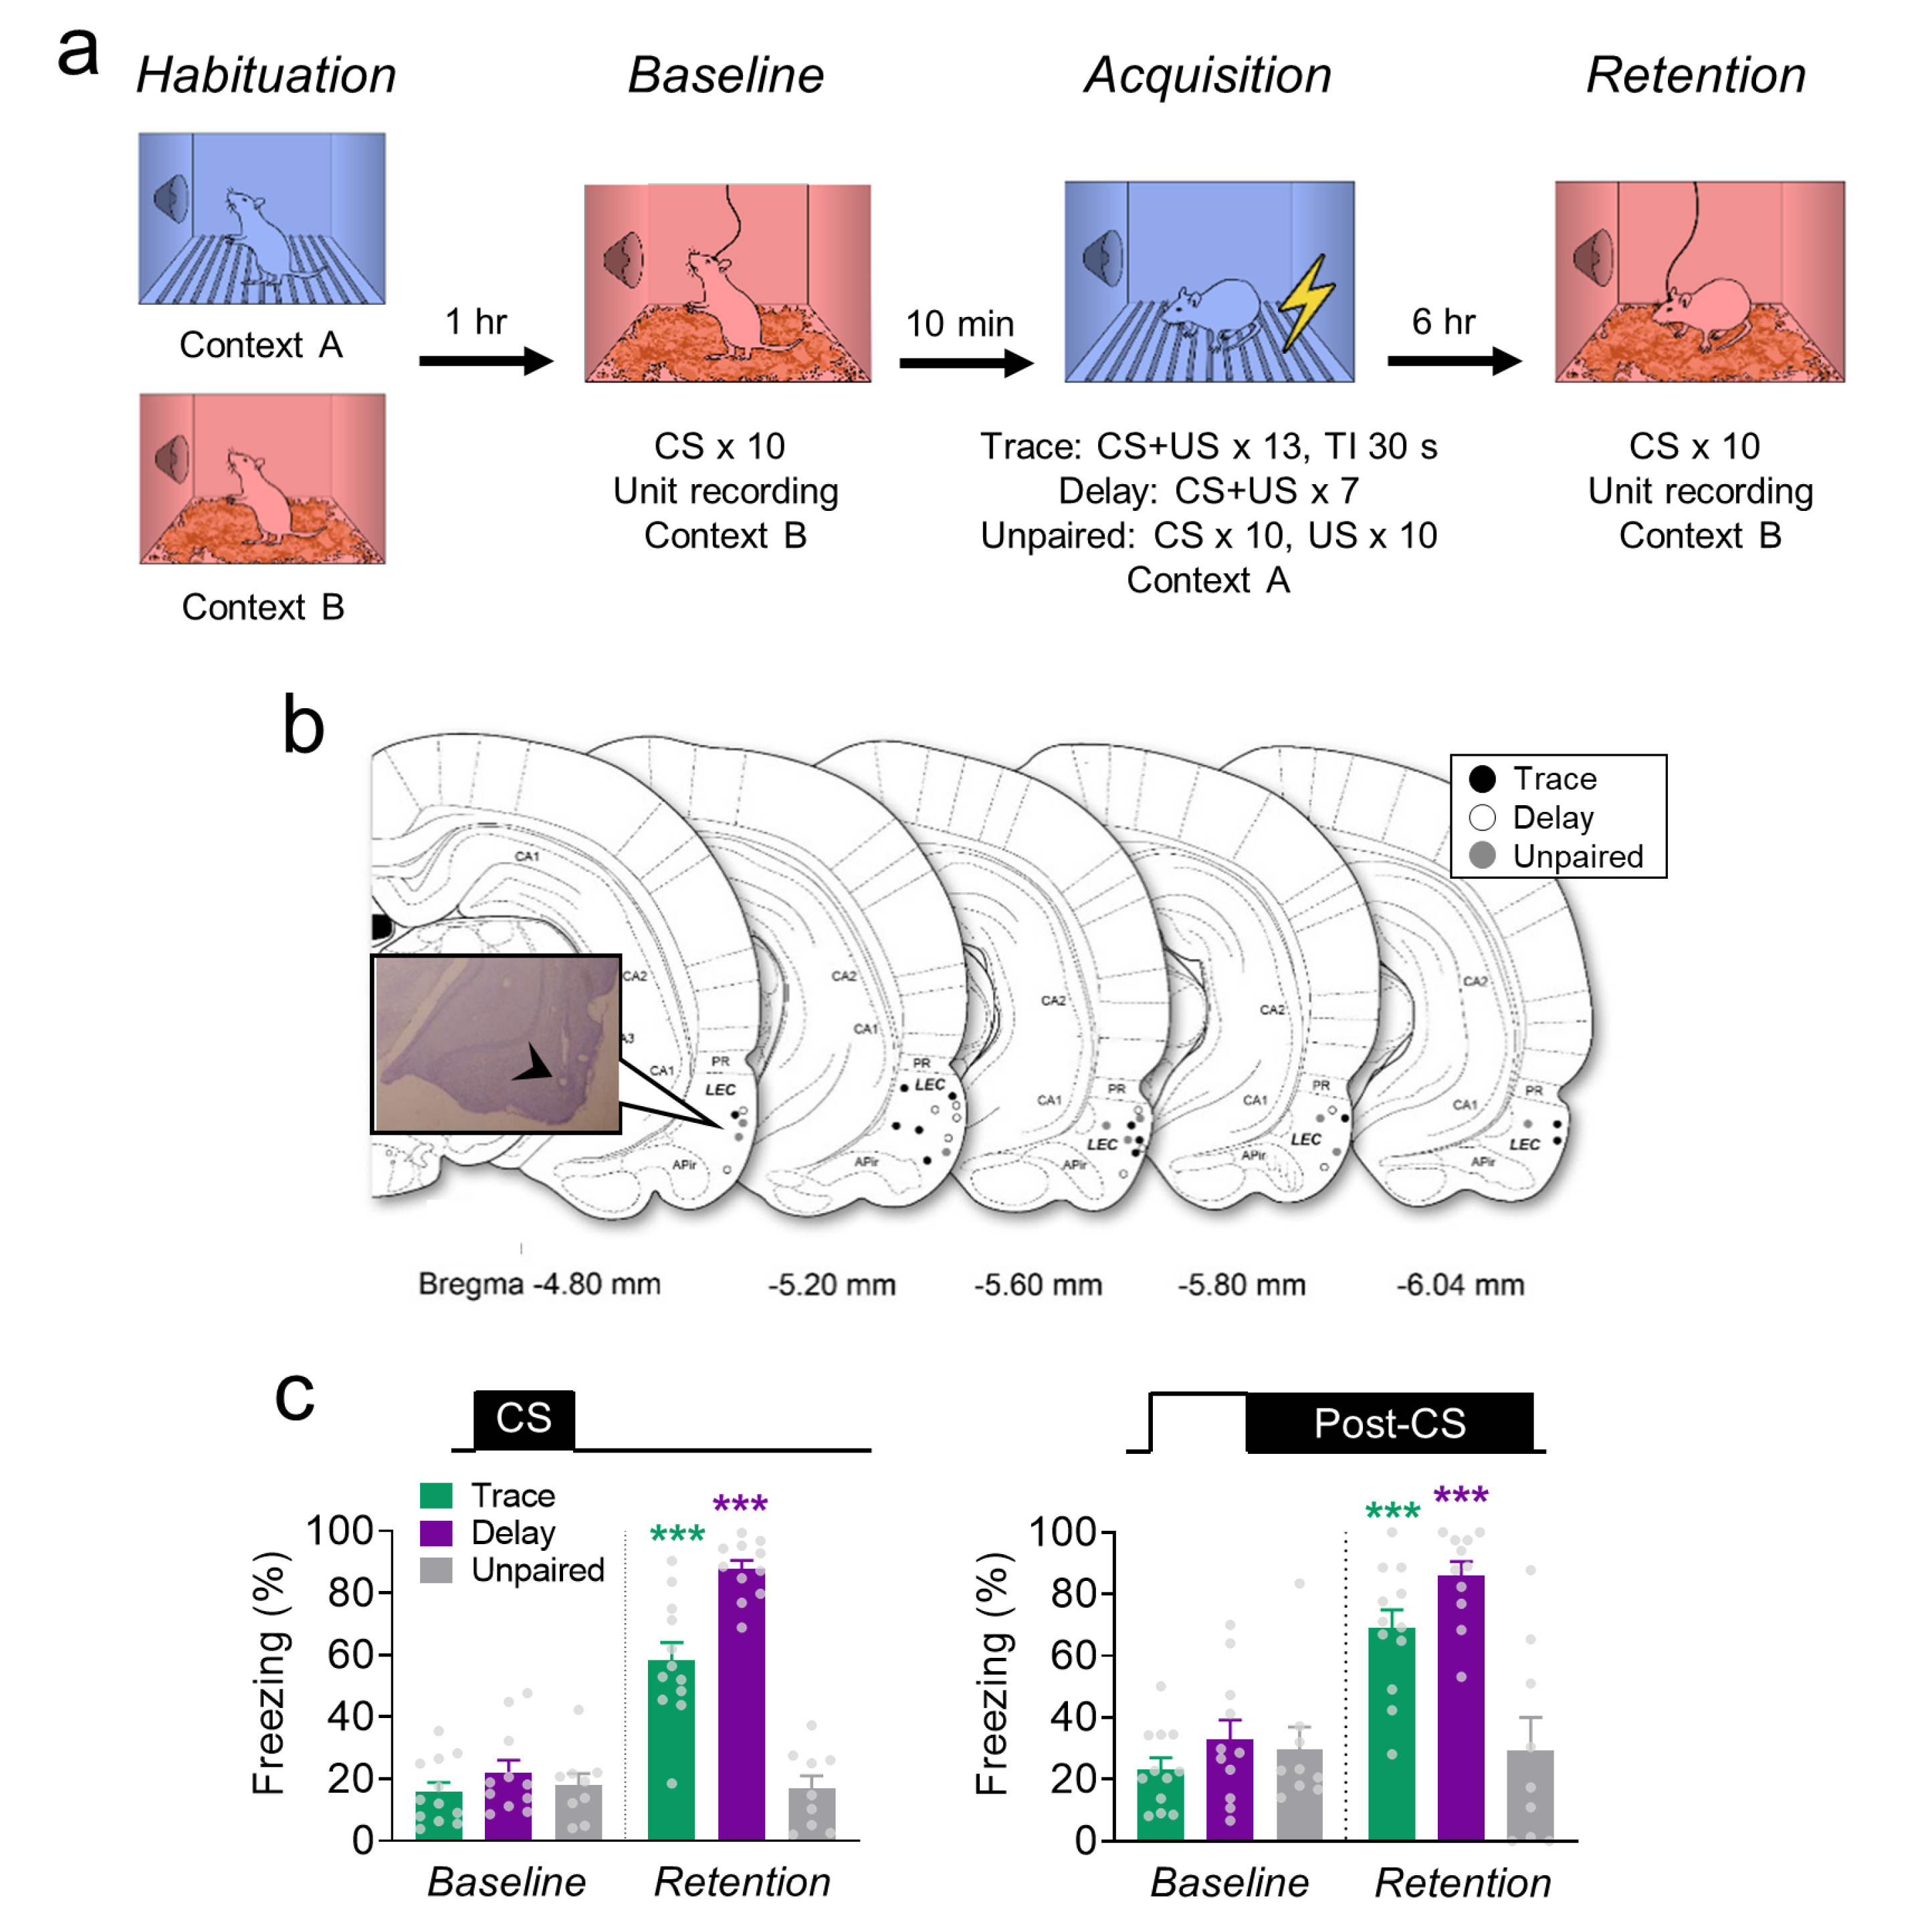
Fig. 2. Behavioral results from Exp.2. (a) Training and recording procedures. (b) Histological reconstructions of the recording sites in the EC (Trace, black; Delay, white; Unpaired, grey) and a photomicrograph of electrode tips in the EC. (c) The mean freezing levels of Trace (n=12, green; green asterisks=baseline vs. retention of Trace), Delay (n=11, purple; purple asterisks=baseline vs. retention of Delay), and Unpaired (n=9, grey) to the CS (left) and post-CS (right) during the baseline and retention sessions. Each circle represents individual data. Data for c were assessed by paired t-test (***p<0.01). All data are represented as mean±SEM.
© Exp Neurobiol