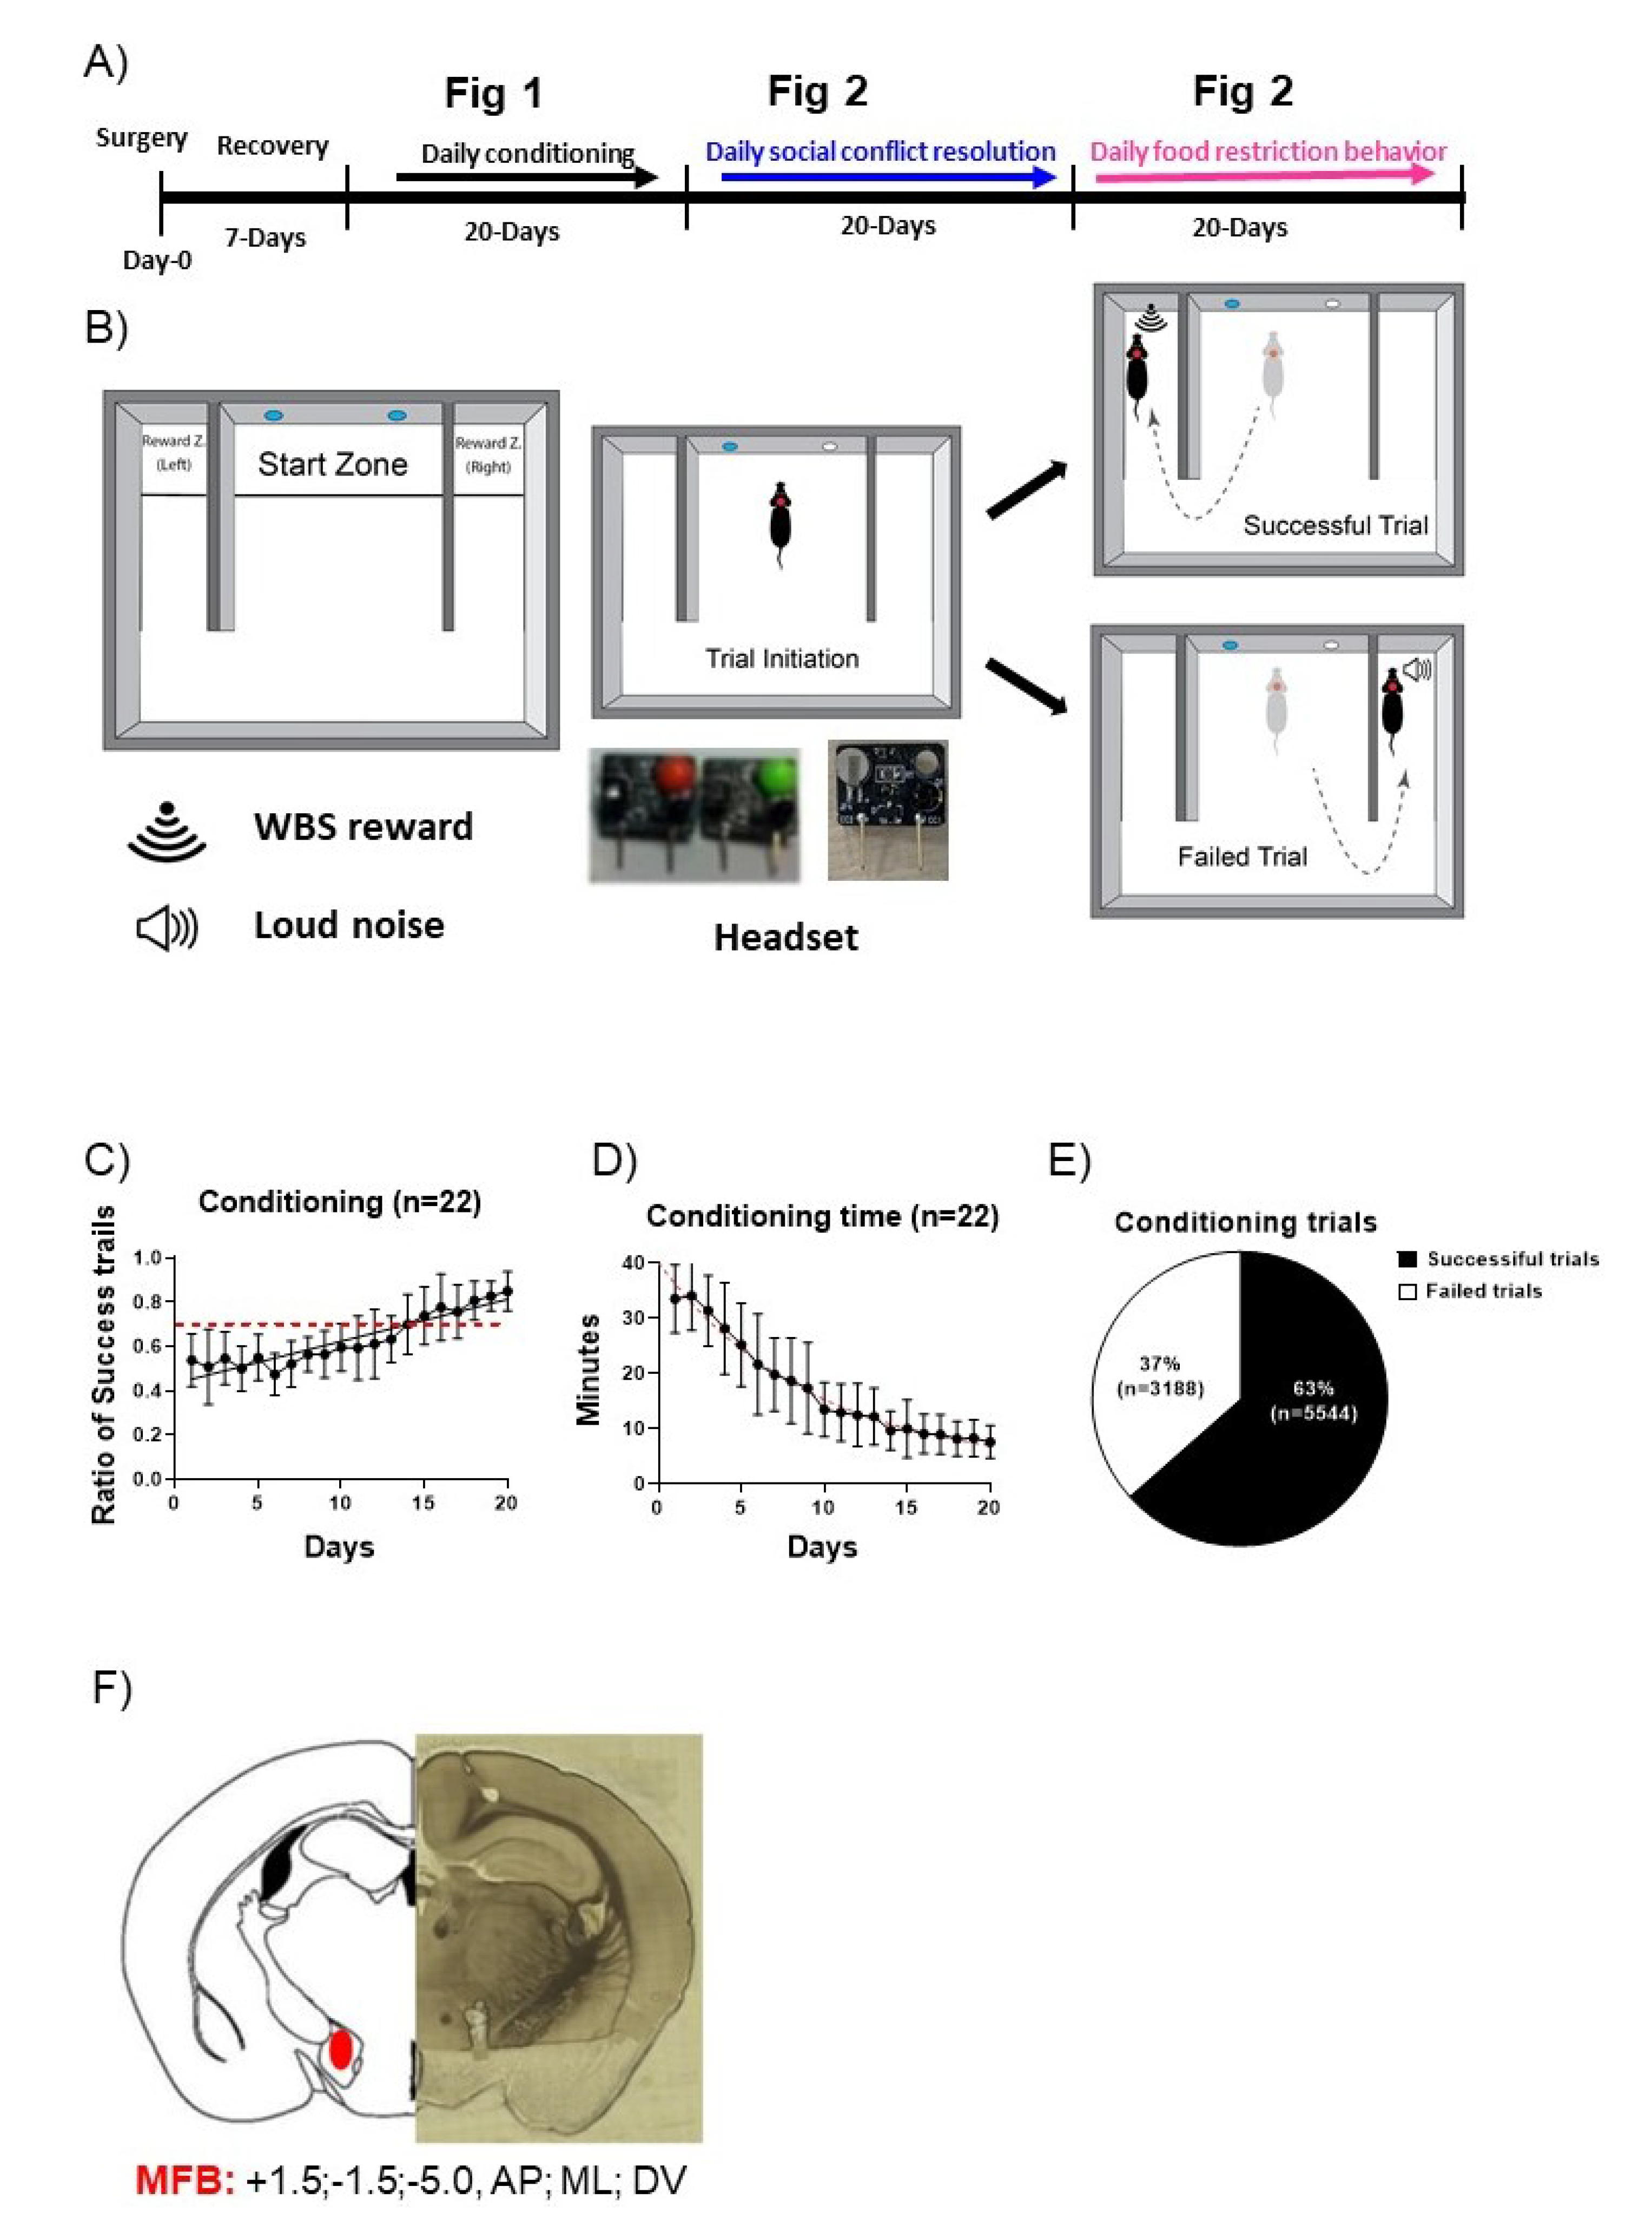
Fig. 1. Classical operant conditioning of rule-observance behavior. (A) Experimental diagram. (B) Schematic representation of the behavior chamber and training paradigm (Start of the trial, successful trial, and failed trial) and photos of two distinct headsets (red and green). (C) The increase in successful trial ratios through the 20 sessions of conditioning. Red-line indicates the significance level of the successful choice (binomial test, p<0.05). (D) Decrease in the time taken for successfully conditioning the animals during the training period. Red dotted line: The decay of time calculated using a nonlinear regression curve. (E) Pie chart showing the ratio between successful trials 63% (n=5,544) and failed trials 37% (n=3,188). (F) The coronal section of the mouse brain showing the implantation site of the silicon probe in the medial forebrain bundle (MFB).
© Exp Neurobiol