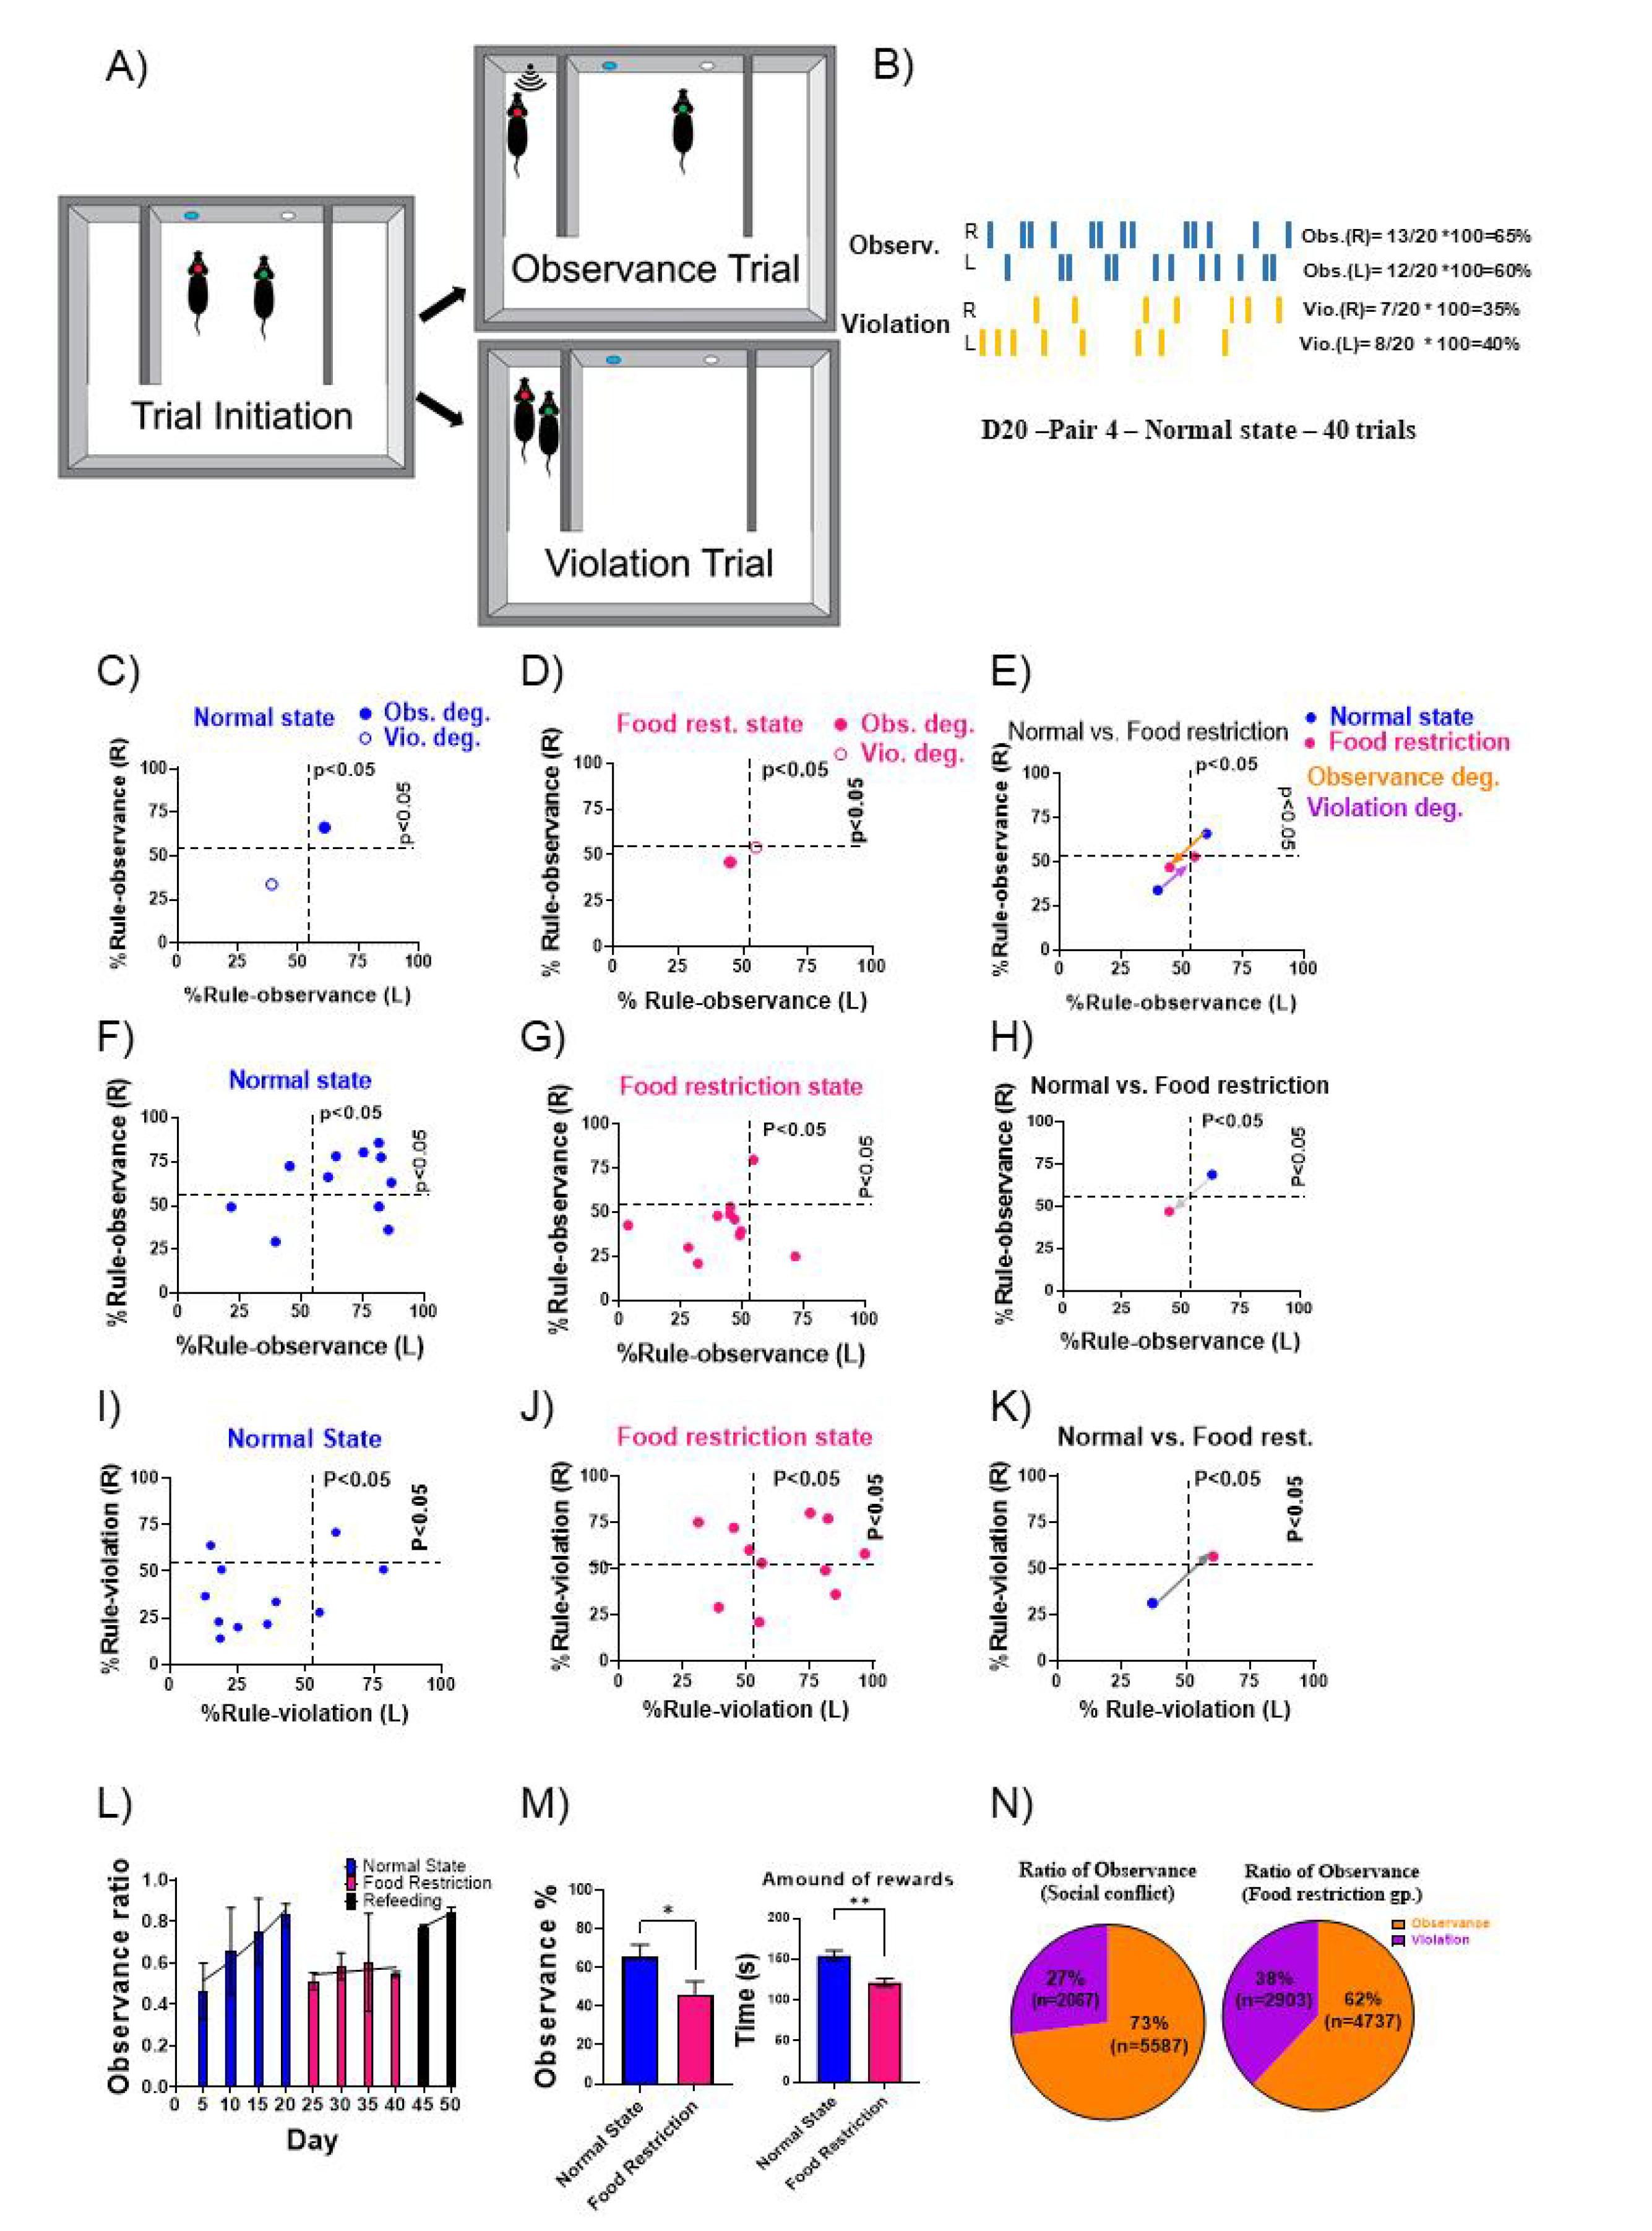
Fig. 2. The effect of hunger on the behavior of mice and reward acquired during rule observance behavior. (A) The social conflict resolution (pair test) diagram in the observance and violation trials. (B) An example of one day of trials demonstrating the observation and violation trials and reward zones (left and right). The pair in this example showed observance with (60 and 65%) percentage and violence with (40 and 35%) percentage. (C) One of the tested pairs with observance (60.9 and 66.3%) and violation (39.1 and 33.7%) behaviors in a normal state. (D) The same pair in a hunger state showed an increase in violation (55 and 54%) and a decrease in observance behaviors (45 and 46%). (E) State transition between normal and hunger state with an increase in violation and decrease in observance behavior. (F) Rule-observance percentage in a normal state for 11 pairs. (G) Observance percentage for the 11 pairs in the food restriction state. (H) The state transition of observance percentage between the normal state and food restriction state. (I, J) Rule-violation percentage in a normal state for 11 pairs in the normal and hunger states. (K) The state transition of violation percentage between the normal and food restriction states. (L) Bar graph representing the trend in average observance percentage shown by 11 mice between the normal and hunger states over the 40-d period. (M) Left, a significant difference in the observance percentage between the normal and food restriction states. Statistical analysis was performed using a two-tailed paired t-test for observance; 0.0168 *p<0.05. Right, payoff equity or the amount of reward between the normal and food restriction state. Two-tailed paired t-test for the amount of reward; 0.0019 **p - p-value summary <0.05). (N) Ratio of observance and violation in the social conflict resolution test in the normal and hunger states.
© Exp Neurobiol