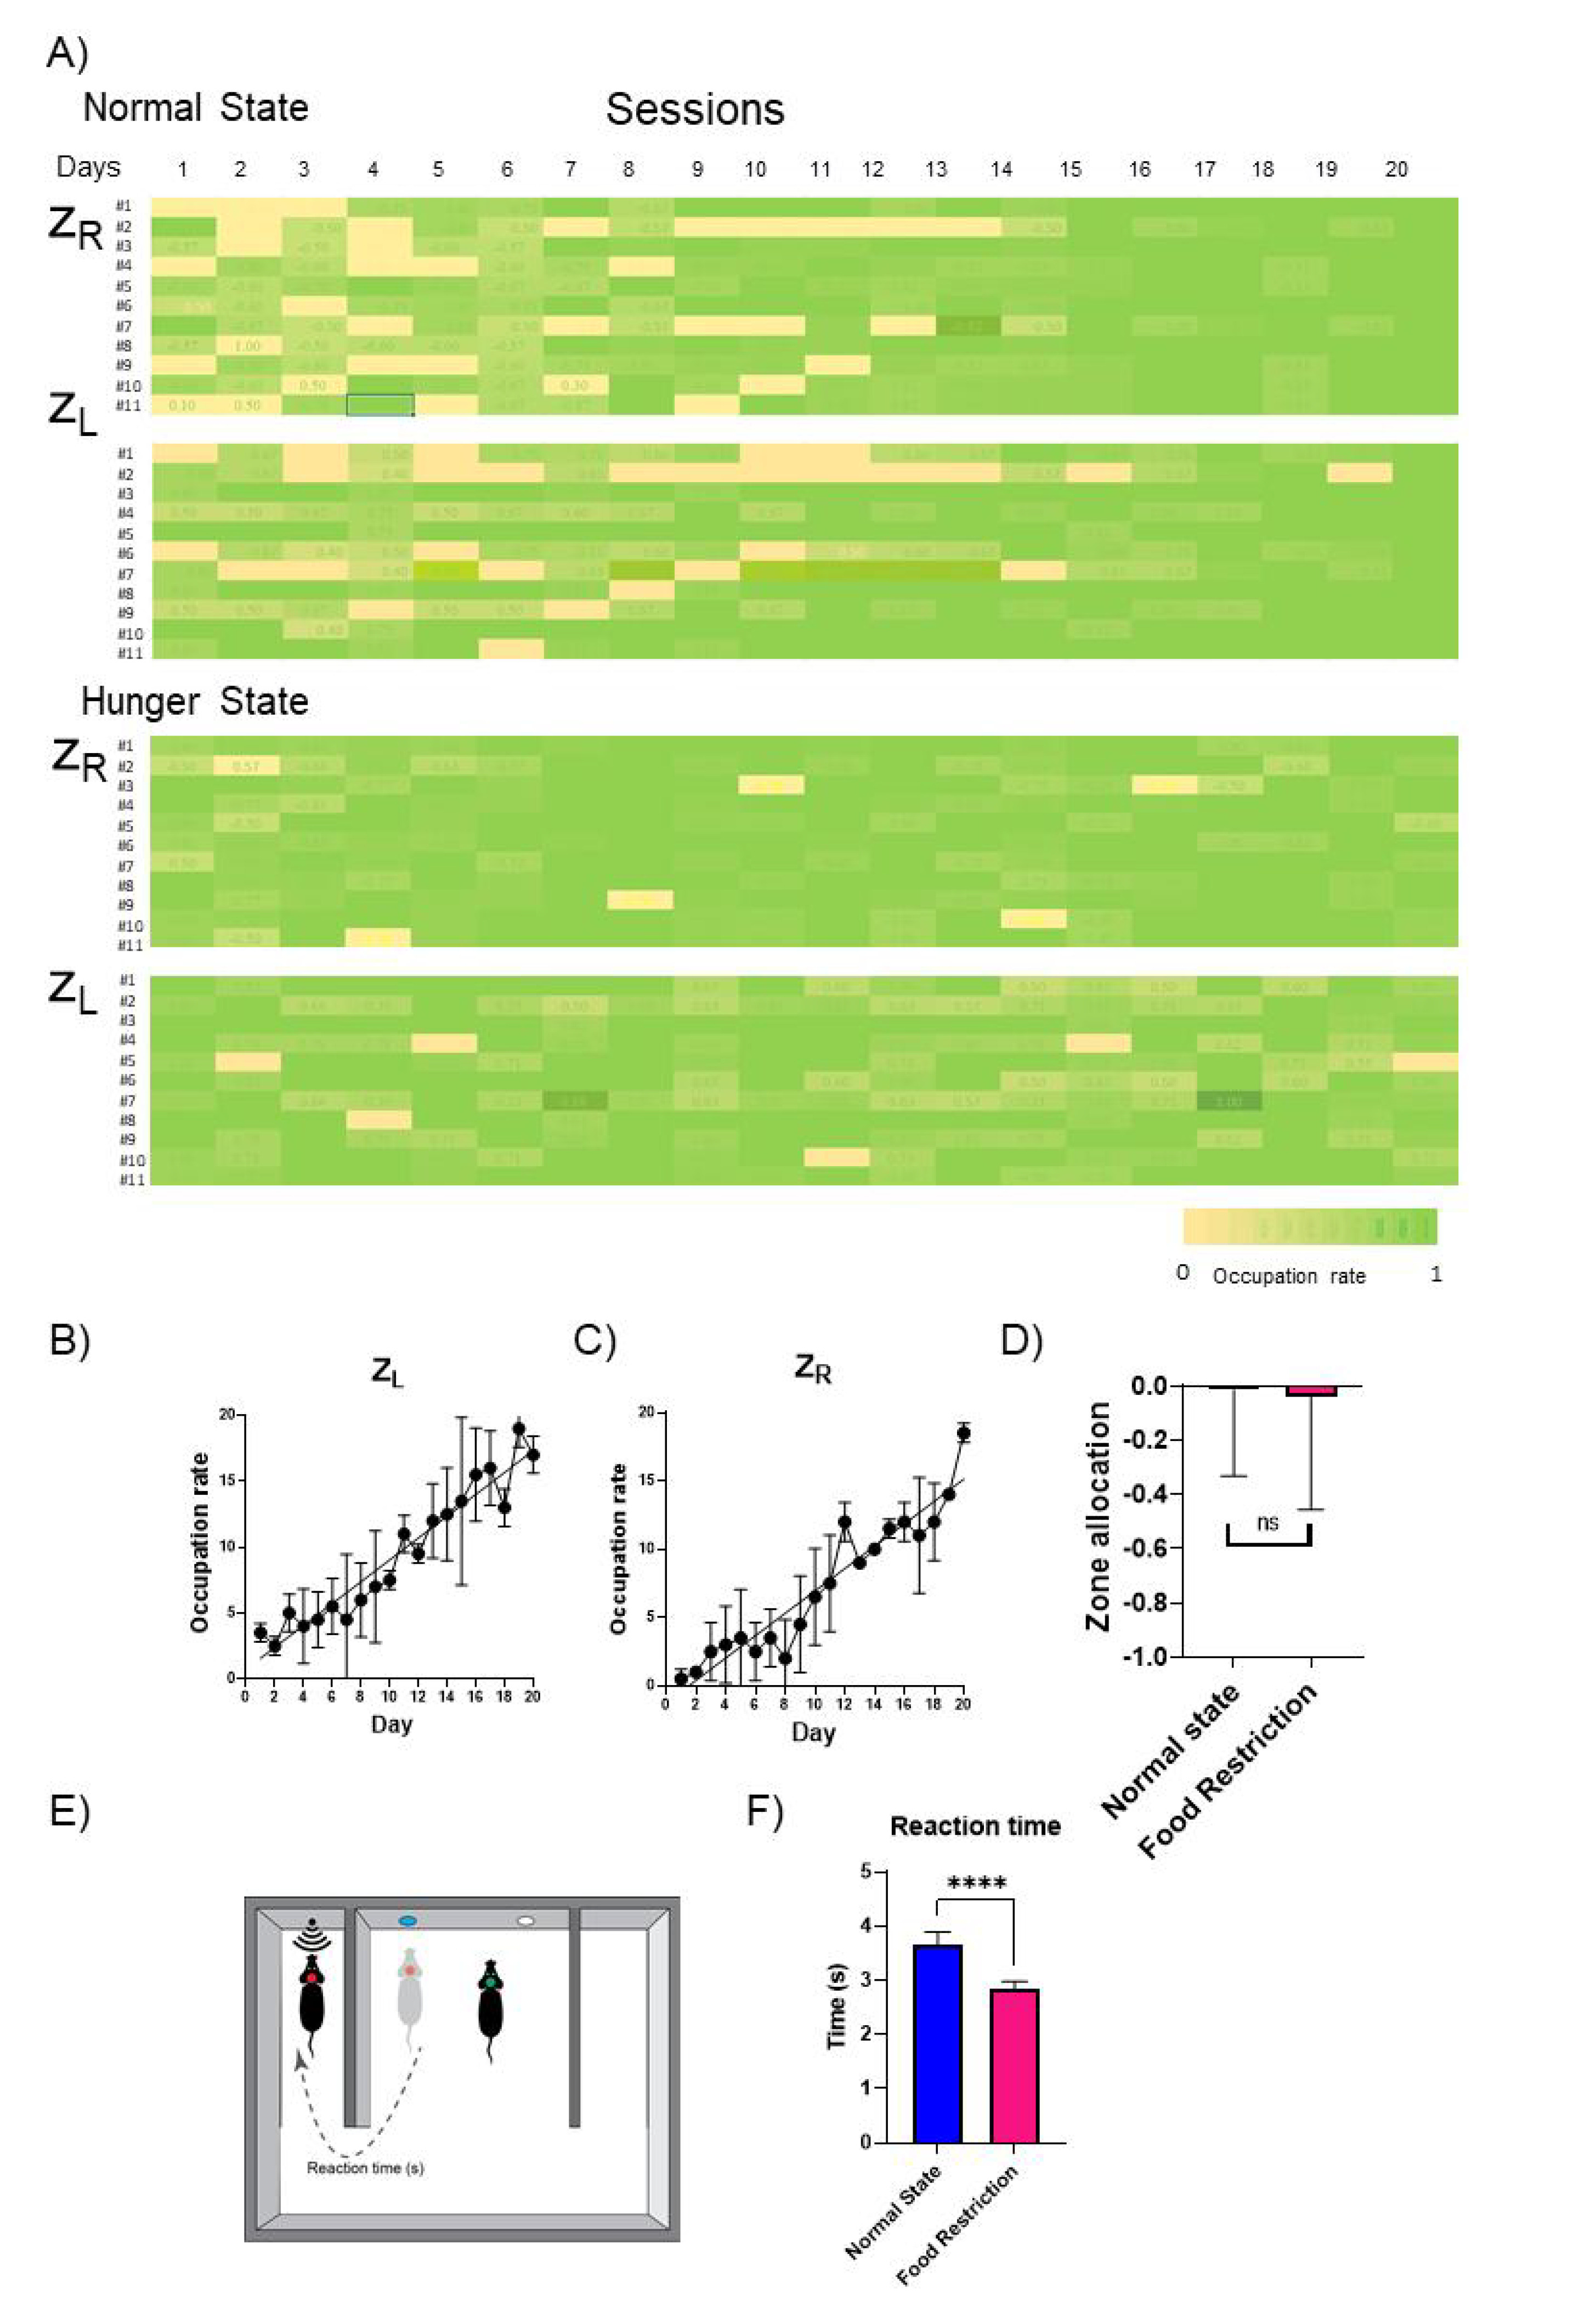
Fig. 3. The spatial and temporal changes during hunger state in the rule-observance behavior test. (A) Reward zone allocation in the left and right zones in the normal and food restriction states. (B) The occupation rate for the left reward zone throughout the 20 d of the social conflict resolution test. (C) The occupation rate for the right reward zone throughout the 20 d of the social conflict resolution test. (D) Zone allocation showed no significant difference in the normal and food restriction states. (paired t-test: p=0.1733). (E) Diagram showing calculation of reaction time. (F) Reaction time in the normal and hunger states (Mann-Whitney test: ****p<0.0001).
© Exp Neurobiol