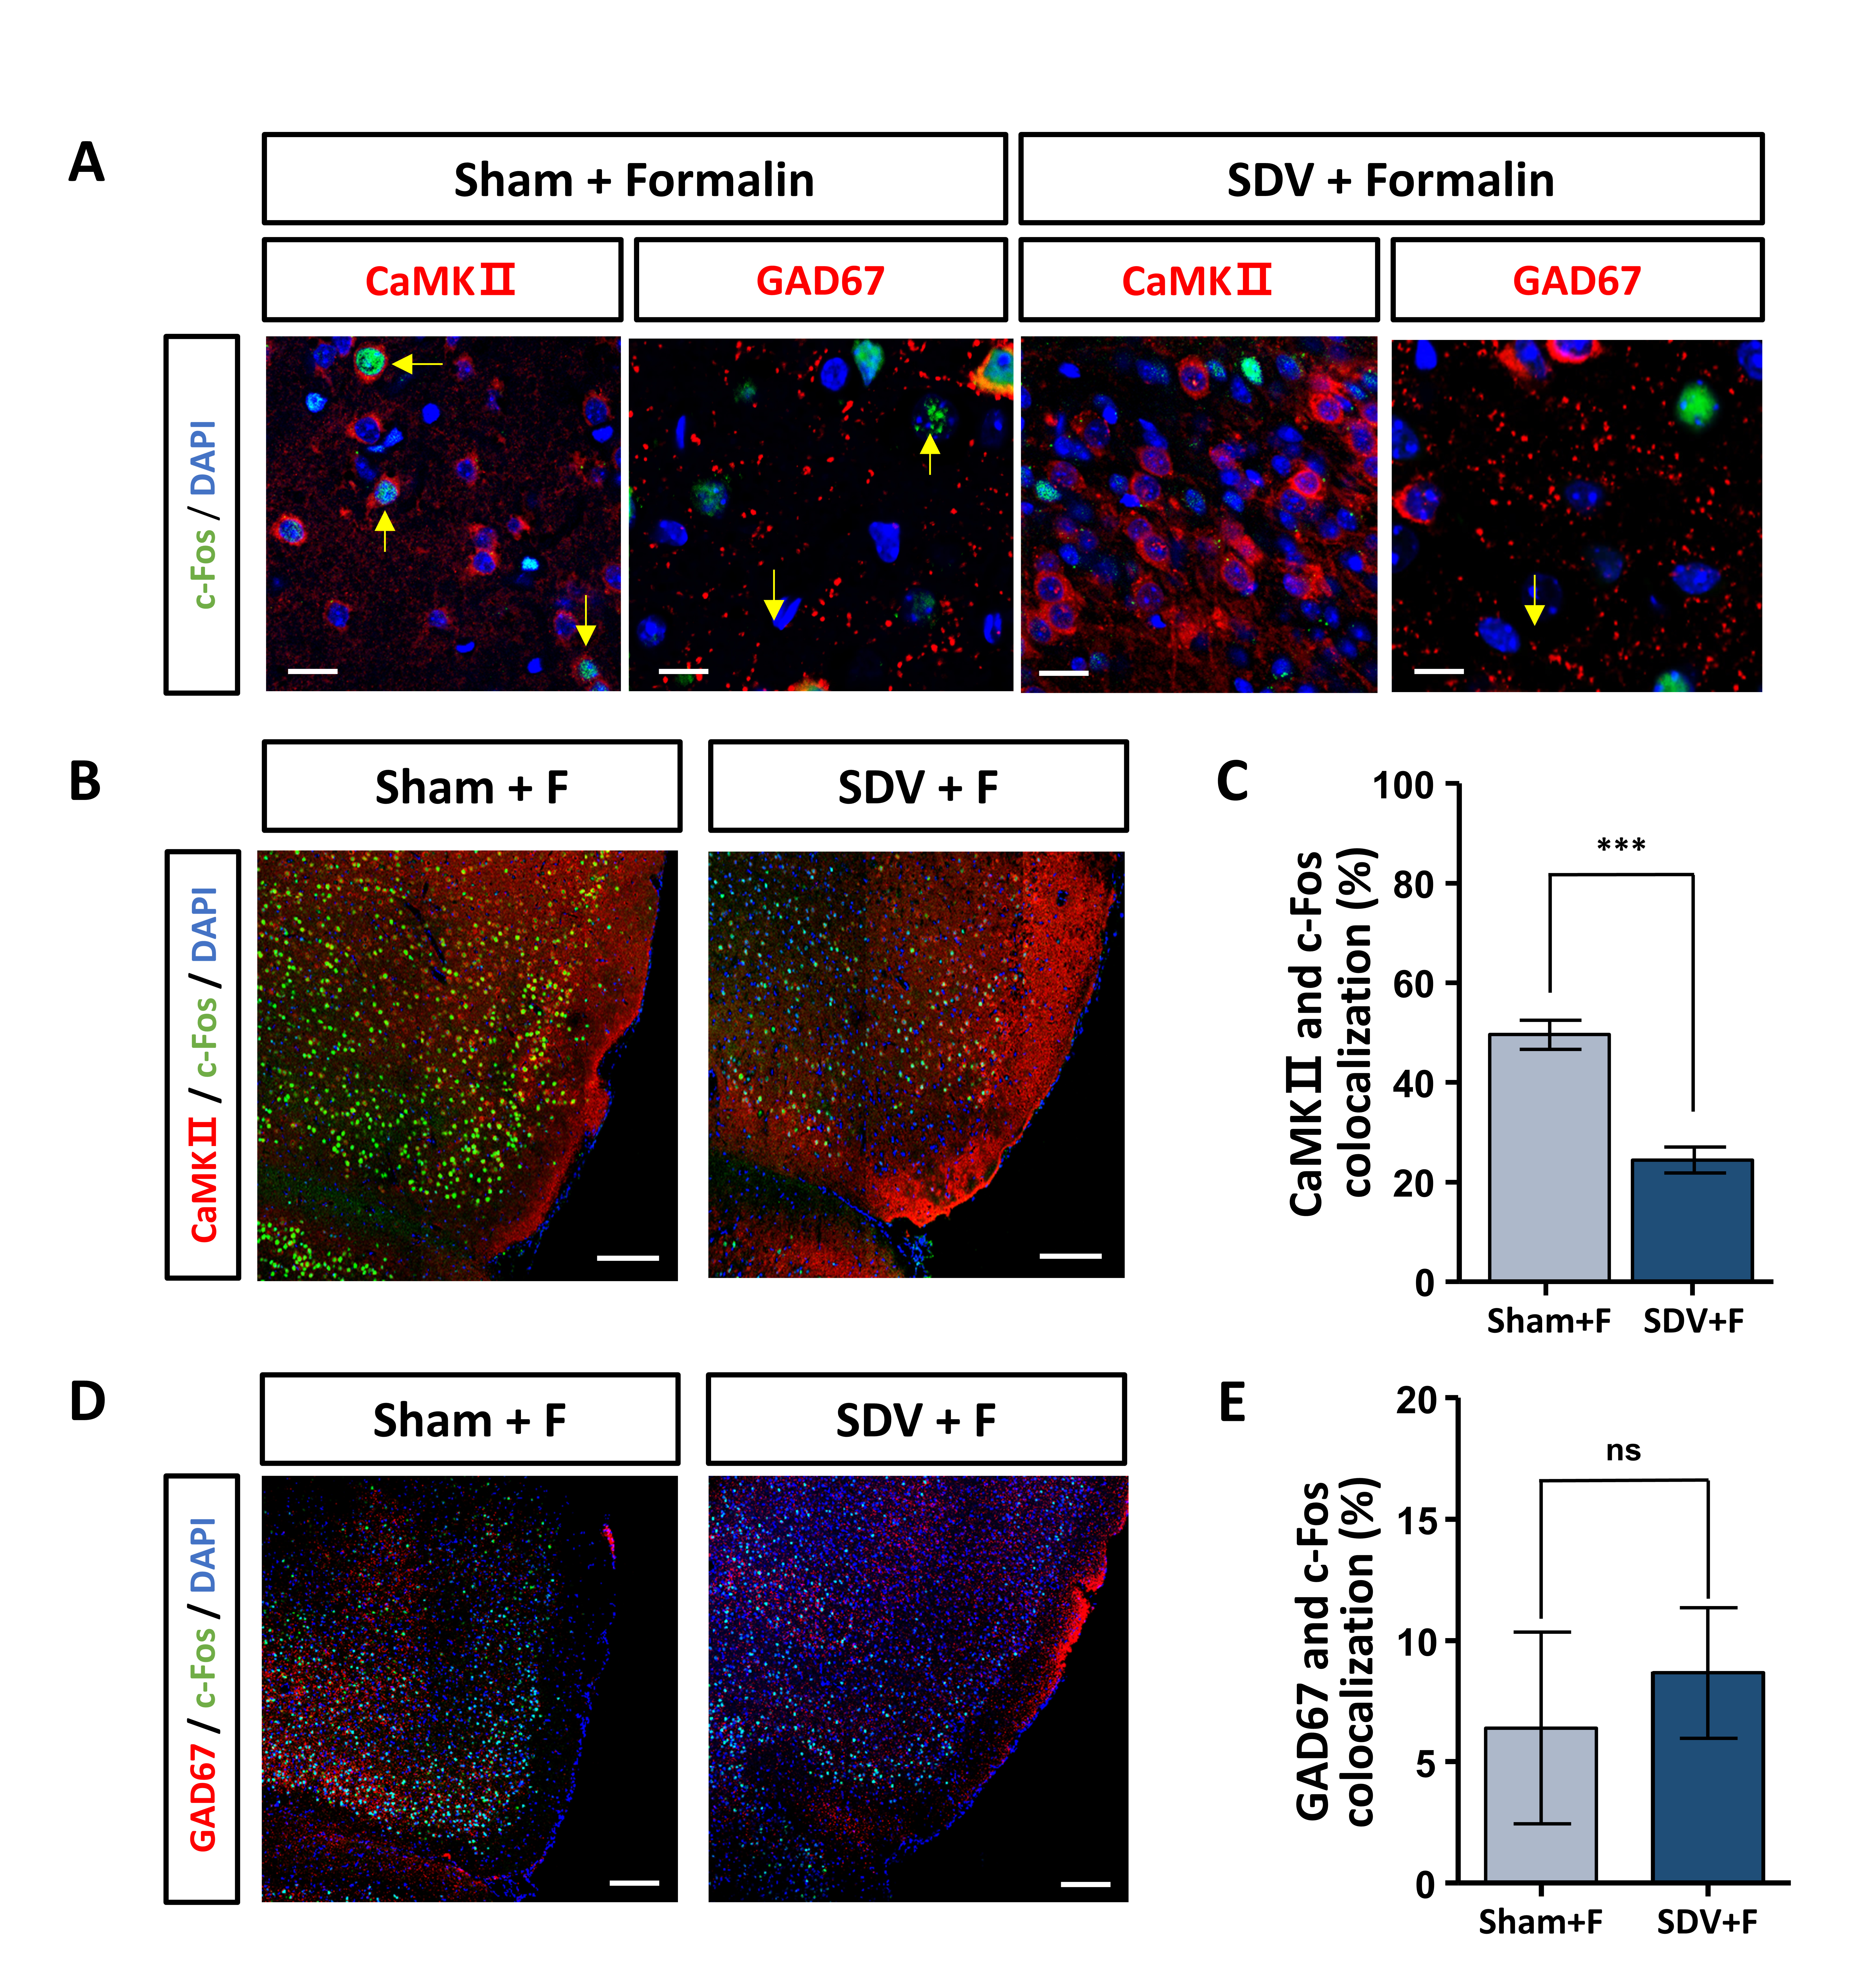
Fig. 4. The pattern of c-Fos expression colocalized with CaMKII or GAD67 in the aIC neurons. (A) Representative fluorescence image illustrating expression of CaMKII or GAD67 (red, yellow arrow indicates co-labeled neurons), c-Fos (green), and DAPI (blue) in the aIC of formalin-treated sham and formalin-treated SDV groups. Scale bar represents 20 μm; magnification 400×. (B) Representative fluorescence image illustrating expression of CaMKII (red), c-Fos (green), and DAPI (blue) in the whole aIC of formalin-treated sham and formalin-treated SDV groups. Scale bar represents 10 μm; magnification 200×. (C) Comparison for levels of CaMKII and c-Fos colocalization in the aIC of formalin-treated sham and formalin-treated SDV groups (n=5 per group). (D) Representative fluorescence image illustrating expression of GAD67 (red), c-Fos (green), and DAPI (blue) in the whole aIC of formalin-treated sham and formalin-treated SDV groups (n=5 per group). Scale bar represents 10 μm; magnification 200×. (E) Comparison for levels of GAD67 and c-Fos colocalization in the aIC of formalin-treated sham and formalin-treated SDV groups. Data are presented as mean±SEM. ***p<0.001 (unpaired Student’s t-test).
© Exp Neurobiol


