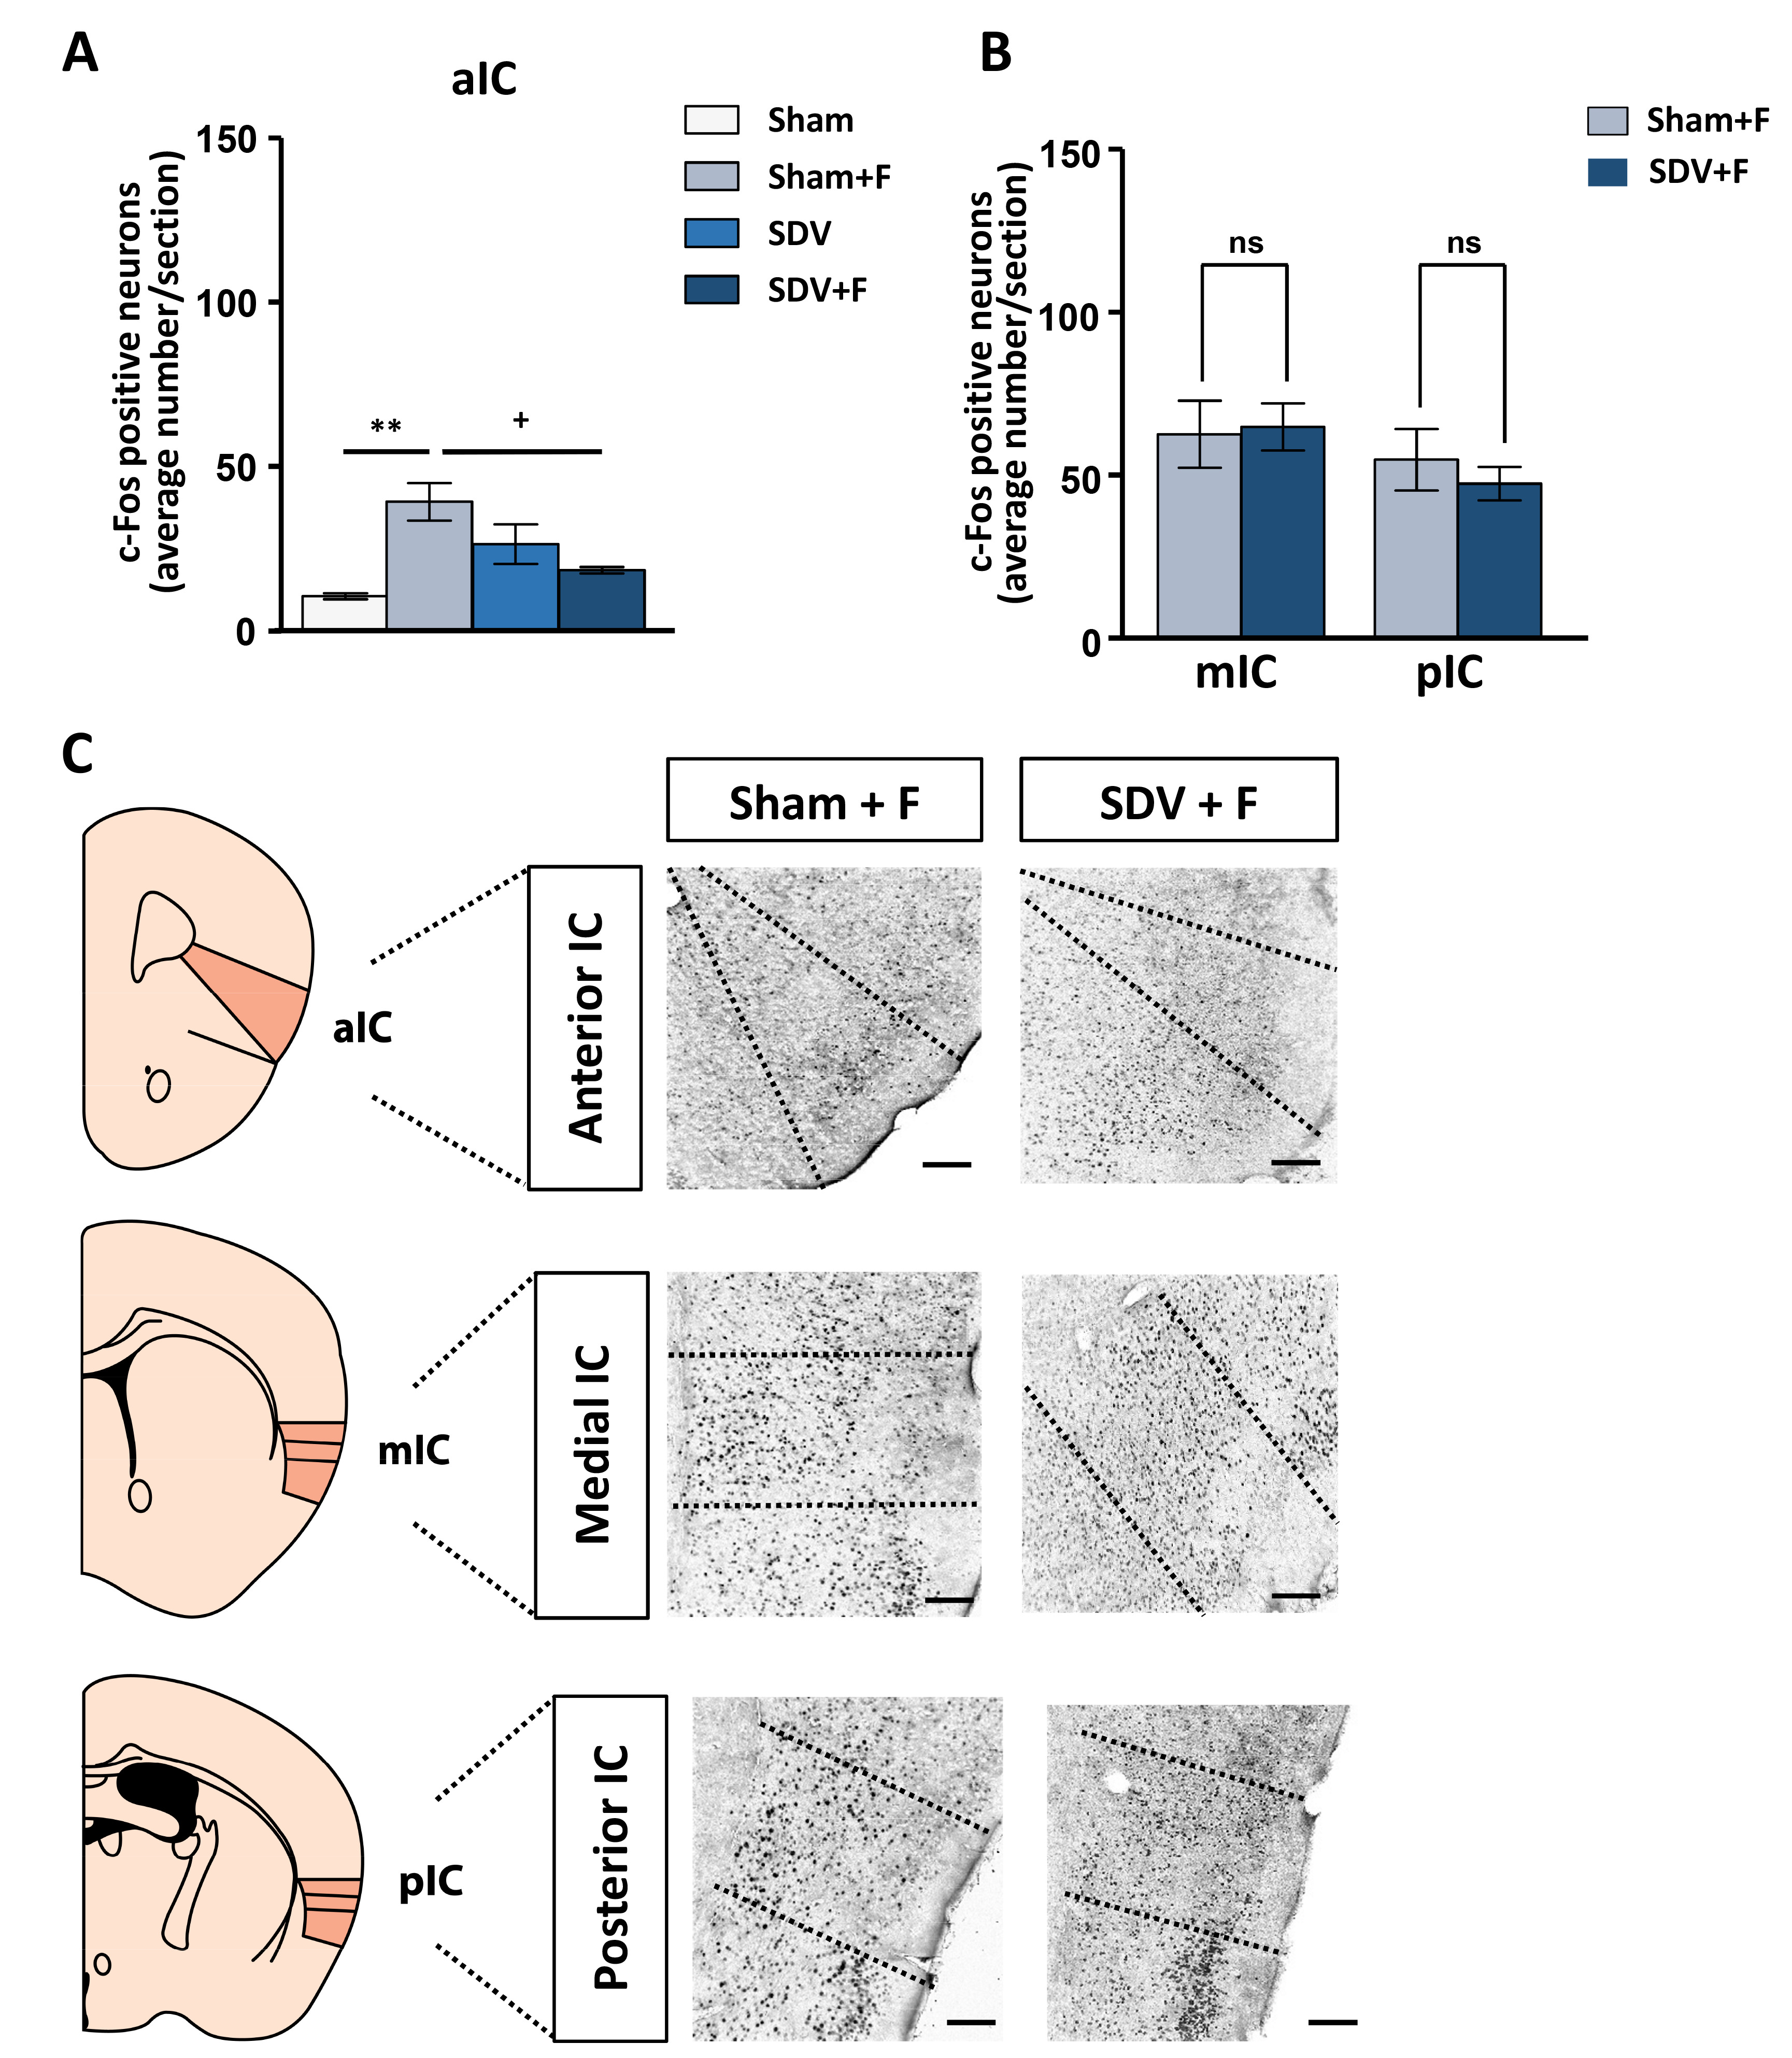
Fig. 2. The patterns of c-Fos expression in the aIC of formalin-treated SDV group. (A) Average number of c-Fos+ cell count in different group of sham, formalin-treated sham, SDV, and formalin-treated SDV group in the aIC on acute inflammatory pain (n=3~6 per group). (B) Average number of c-Fos+ cell count of formalin-treated sham and formalin-treated SDV groups in the mIC and pIC on acute inflammatory pain (n=3~6 per group). (C) Schematic representation and representative photomicrographs of c-Fos observed in the aIC, mIC and pIC of formalin-treated sham and formalin-treated SDV groups. Representative regions in coronal sections based on the atlas of Paxinos and Watson (2nd edition). Scale bar represents 100 μm; magnification 10×. Asterisk represents significant changes of c-Fos between sham and formalin-treated sham groups. Cross represents significant changes of c-Fos between formalin-treated sham and formalin-treated SDV group. Data are presented as mean±SEM. **p<0.01; +p<0.05 (two-way ANOVA followed by Bonferroni test).
© Exp Neurobiol