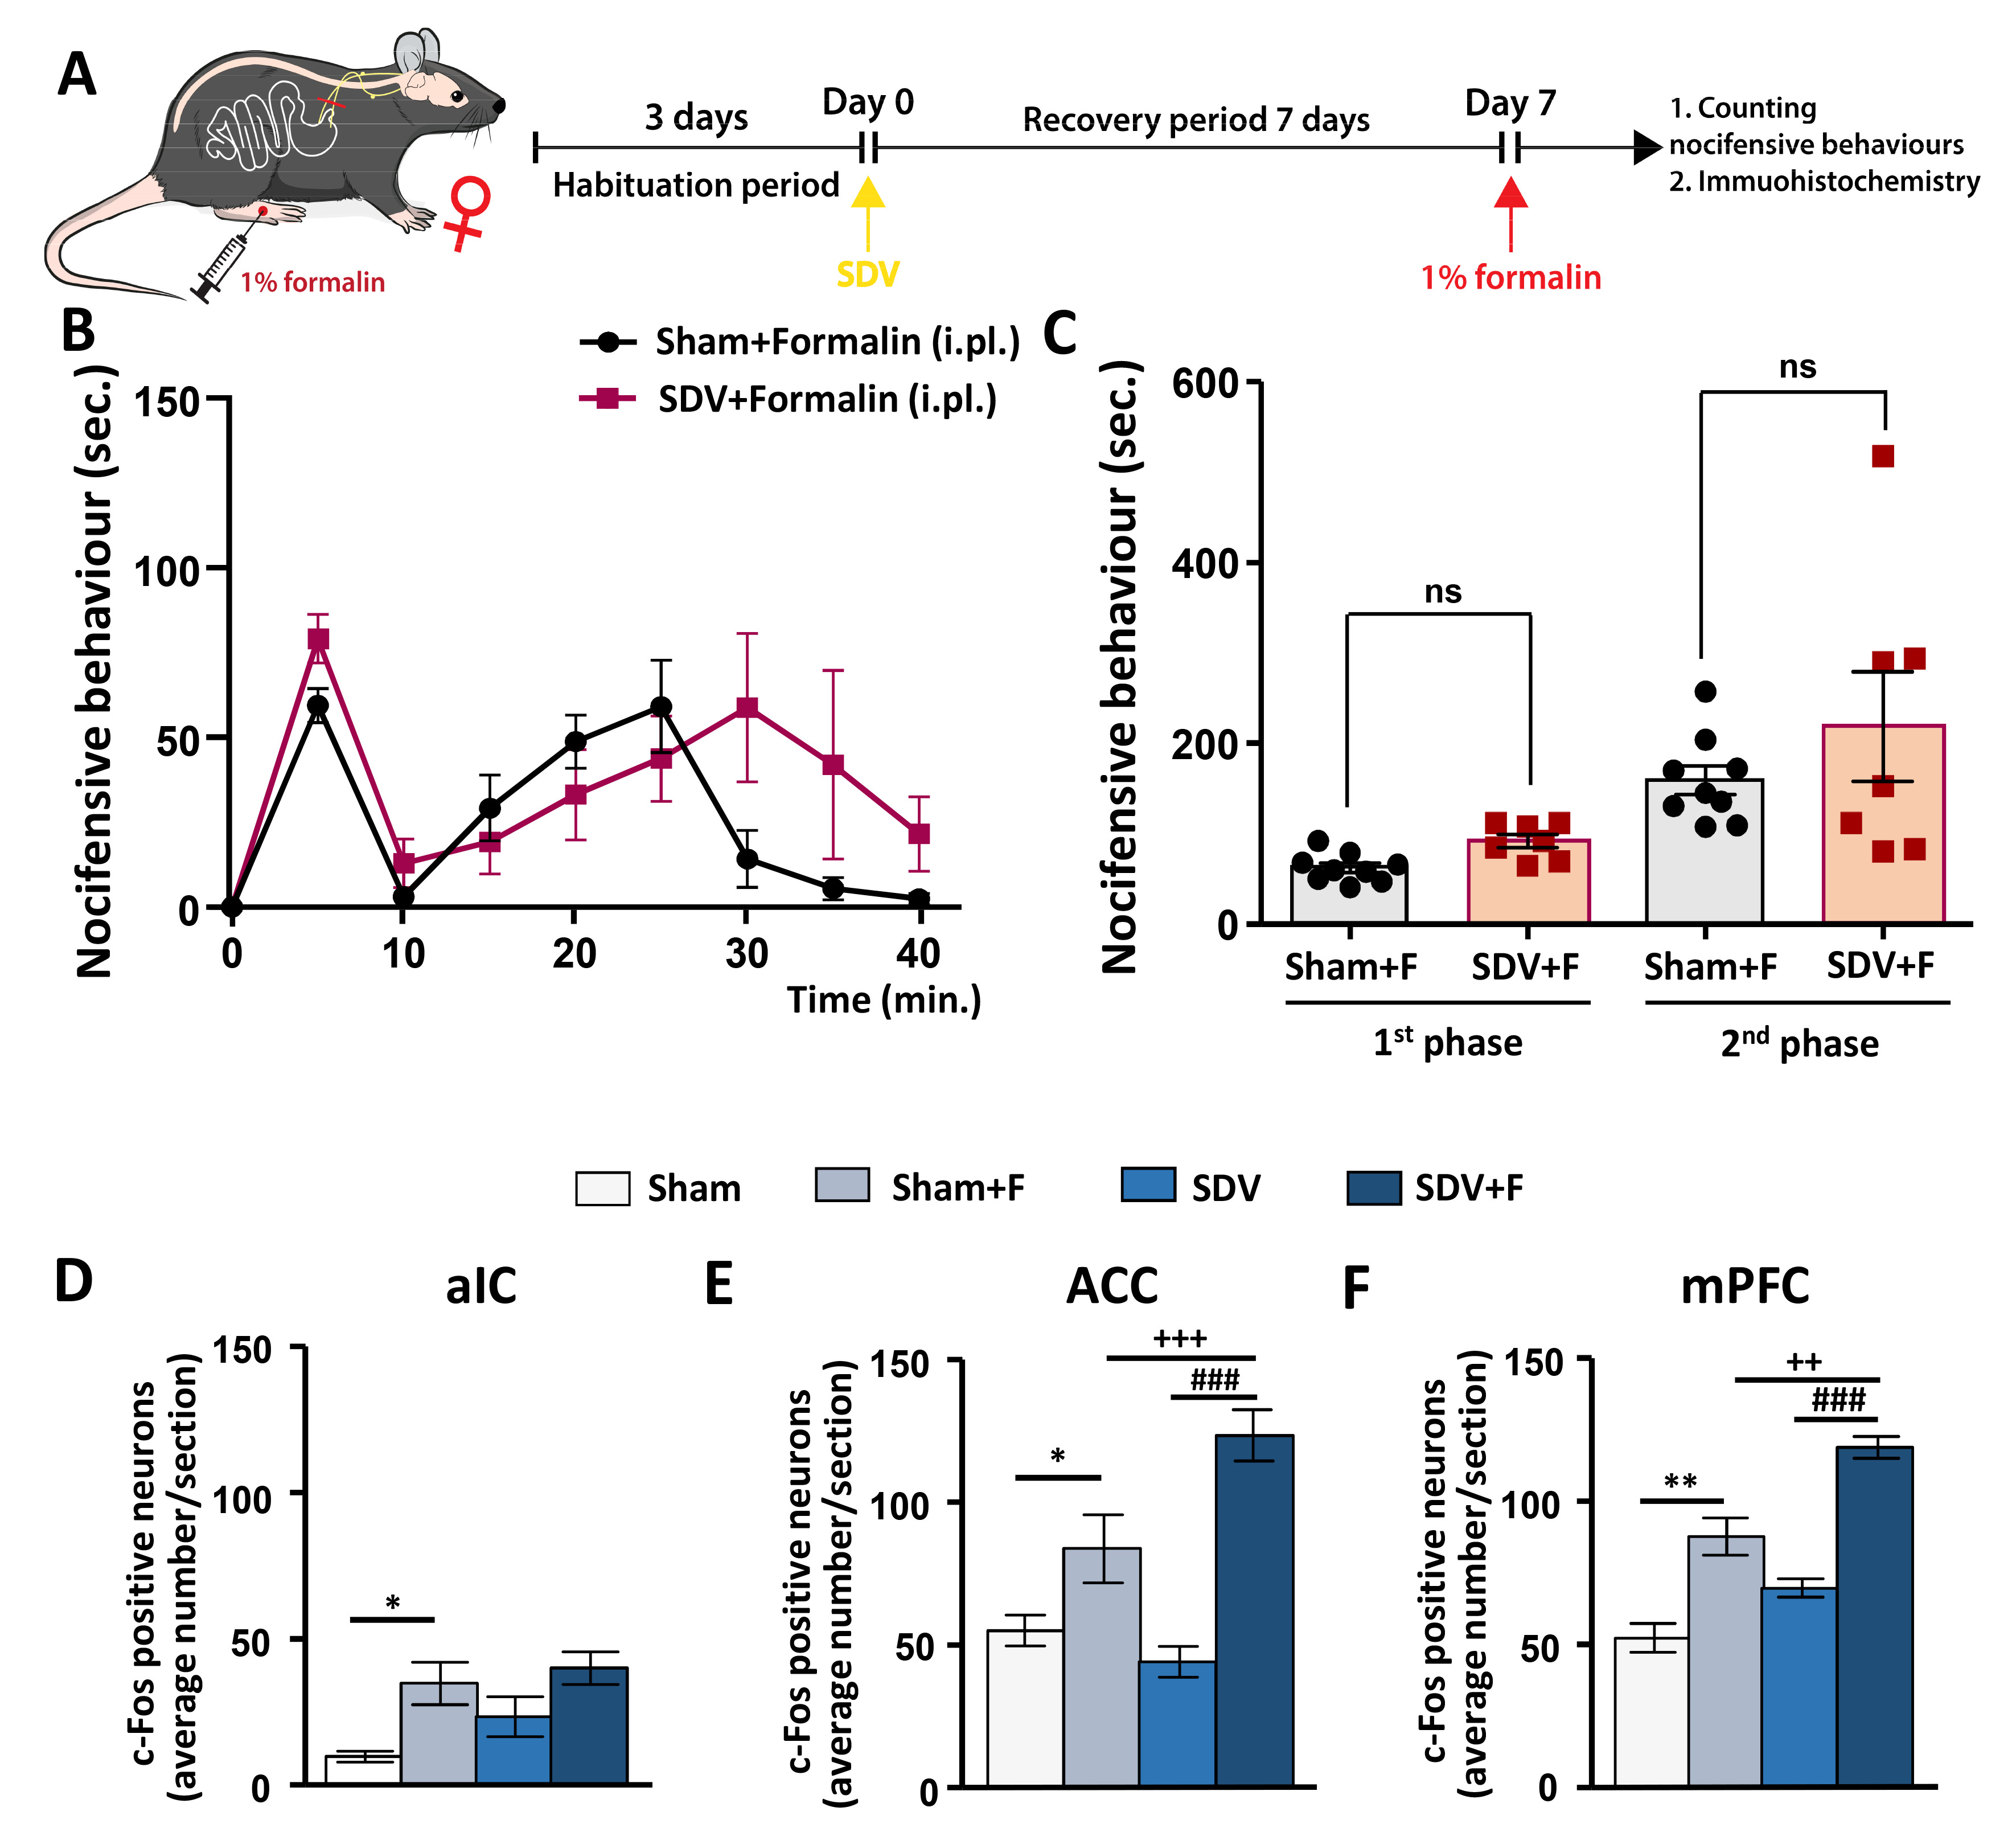
Fig. 3. The patterns of c-Fos expression in the aIC, ACC and mPFC of formalin-treated SDV group in female mice. (A) Schematic diagram of experiment schedule design. (B) No effect of SDV on formalin-induced acute inflammatory pain in female mice (n=9 and 7 for sham and SDV, respectively). (C) Comparison for nocifensive behaviors in the first and second phase of formalin test between formalin-treated sham and formalin-treated SDV group in female mice. (D) Average number of c-Fos+ cell count in the aIC of all groups on acute inflammatory pain. (E) Average number of c-Fos+ cell count in the ACC of all groups on acute inflammatory pain. (F) Average number of c-Fos+ cell count in the mPFC of all groups on acute inflammatory pain. Asterisk represents significant changes of c-Fos between sham and formalin-treated sham groups. Cross represents significant changes of c-Fos between formalin-treated sham and formalin-treated SDV group. Sharp represents significant changes of c-Fos between SDV and formalin-treated SDV group. Data are presented as mean±SEM. *p<0.05, **p<0.01; ++p<0.01, +++p<0.001; ###p<0.001 (two-way ANOVA followed by Bonferroni test).
© Exp Neurobiol