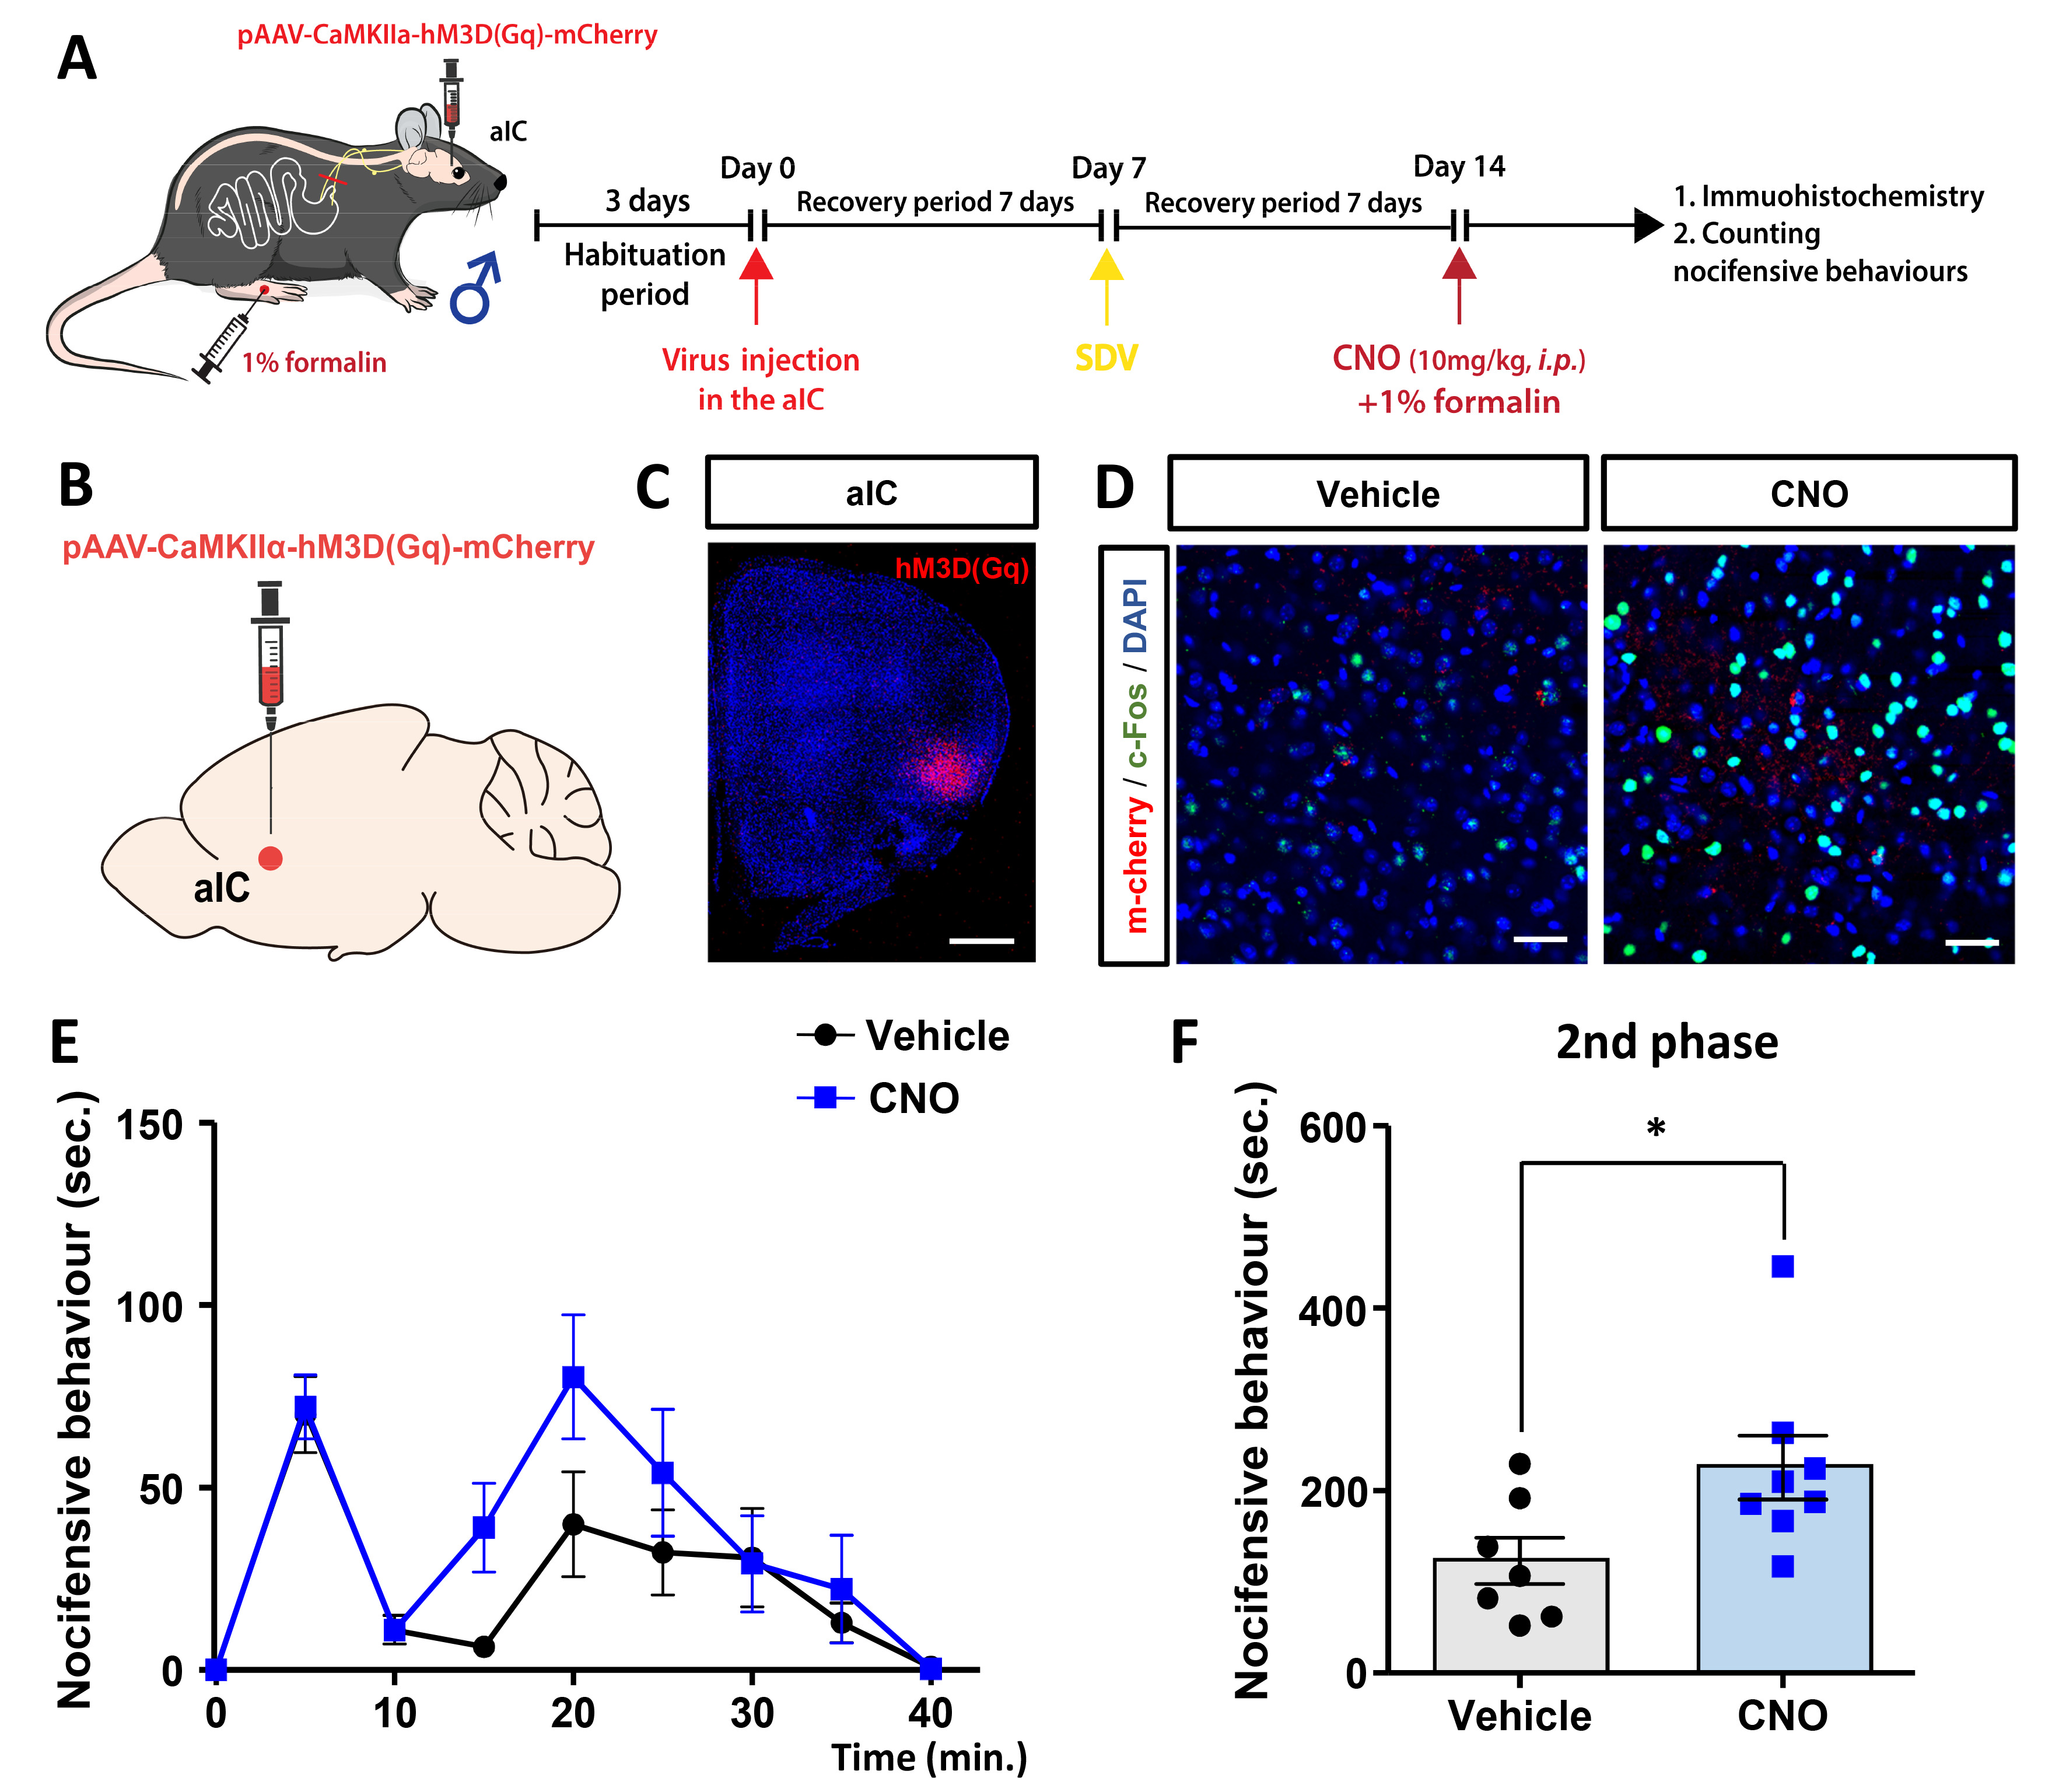
Fig. 6. Effect of chemogenetic activation of aICCaMKII on SDV-induced analgesia. (A) Schematic diagram of experiment schedule design. (B) Sagittal view of virus injection into the aIC. (C) Representative fluorescence image illustrating expression of hM3Dq at the injection site. Scale bar represents 500 μm; magnification 100× tiled scan. (D) Representative images of c-Fos (green), hM3Dq (red) and DAPI (blue) expression in the aIC that were administered vehicle or CNO. Scale bar represents 20 μm; magnification 200×. (E) Change in formalin test with vehicle or CNO infusion in the SDV group (n=7 and 8 for vehicle and CNO, respectively). (F) Comparison for nocifensive behaviors with vehicle or CNO infusion in acute inflammatory pain group (n=7 and 8 for vehicle and CNO, respectively). Data are represented as mean±SEM. *p<0.05 (unpaired Student’s t-test).
© Exp Neurobiol