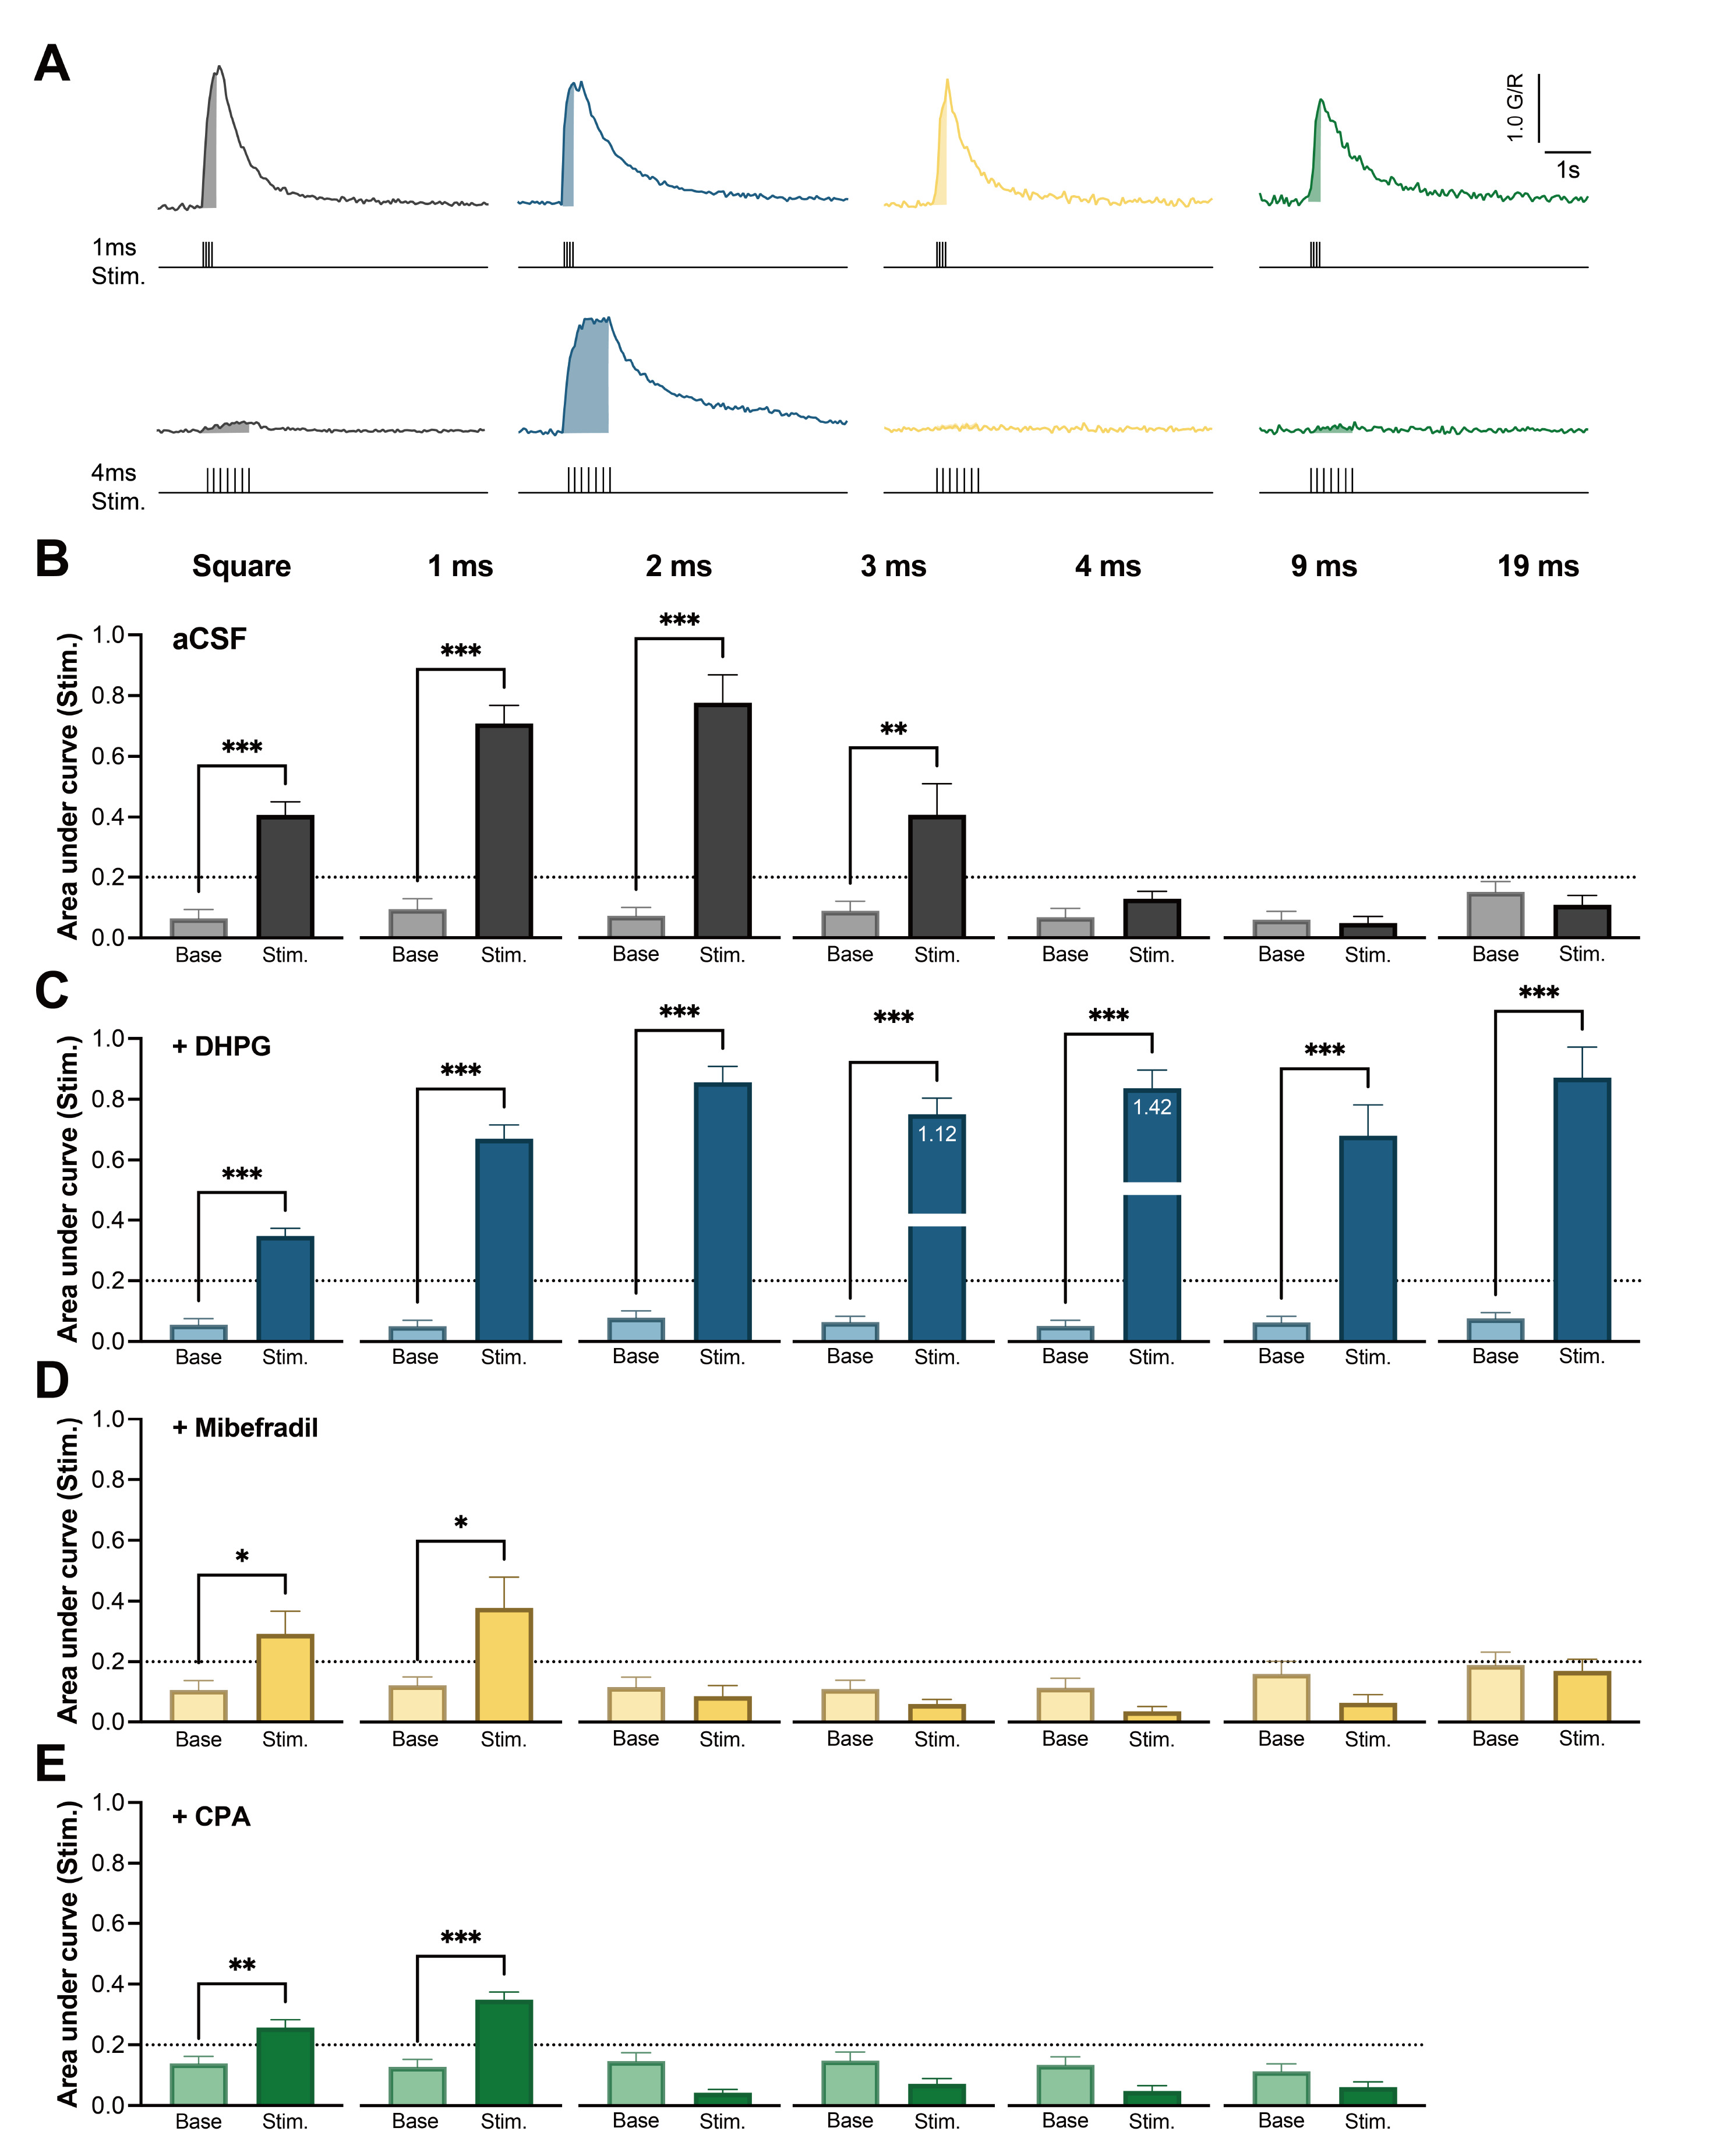
Fig. 2. The interspike interval threshold (ISIT) was modulated by drug treatments. (A) Representative Ca2+ transients from each group. The Ca2+ transient during the 1 ms ISI stimulation (upper, shade) and 4 ms ISI stimulation (lower, shade). (B) Normal ISIT was lower than 4 ms. Ca2+ transients were significant increase until 3 ms interval, but the AUC became lower than 0.2, which is the minimum criteria (see Materials and Methods), from 4 to 19 ms interval (Square, n=25, p<0.001; 1 ms, n=23, p<0.001; 2 ms, n=23, p<0.001; 3 ms, n=23, p=0.005; 4 ms, n=23; 9 ms, n=23; 19 ms, n=7). (C) Activation of mGluR through DHPG (10 µM) increases the ISIT to more than 19 ms. The AUC during stimulation became significantly larger than baseline by DHPG application in all intervals (Square, n=16, p<0.001; 1 ms, n=13, p<0.001; 2 ms, n=13, p<0.001; 3 ms, n=13, p<0.001; 4 ms, n=13, p<0.001; 9 ms, n=16, p<0.001; 19 ms, n=9, p<0.001). (D) Blocking of T-type Ca2+ channels by mibefradil (1 µM) decreases the ISIT to lower than 2 ms (n=9 for all stimulation groups). Only the square and 1 ms interval stimulation induce significant Ca2+ transients during the stimulation (Square, p=0.033; 1 ms, p=0.026). In other stimulations, the AUC was lower than 0.2 (E) ER depletion by CPA (30 µM) treatment decreases the ISIT to lower than 2 ms (n=5 for all stimulation groups). Same as the mibefradil treatment group, the square and 1 ms interval stimulation induces significant Ca2+ transients during the stimulation (Square, p=0.010; 1 ms, p<0.001). Two-tailed t-test was used for all comparisons. Error bar indicates SEM. *p<0.05, **p<0.01, ***p<0.001.
© Exp Neurobiol