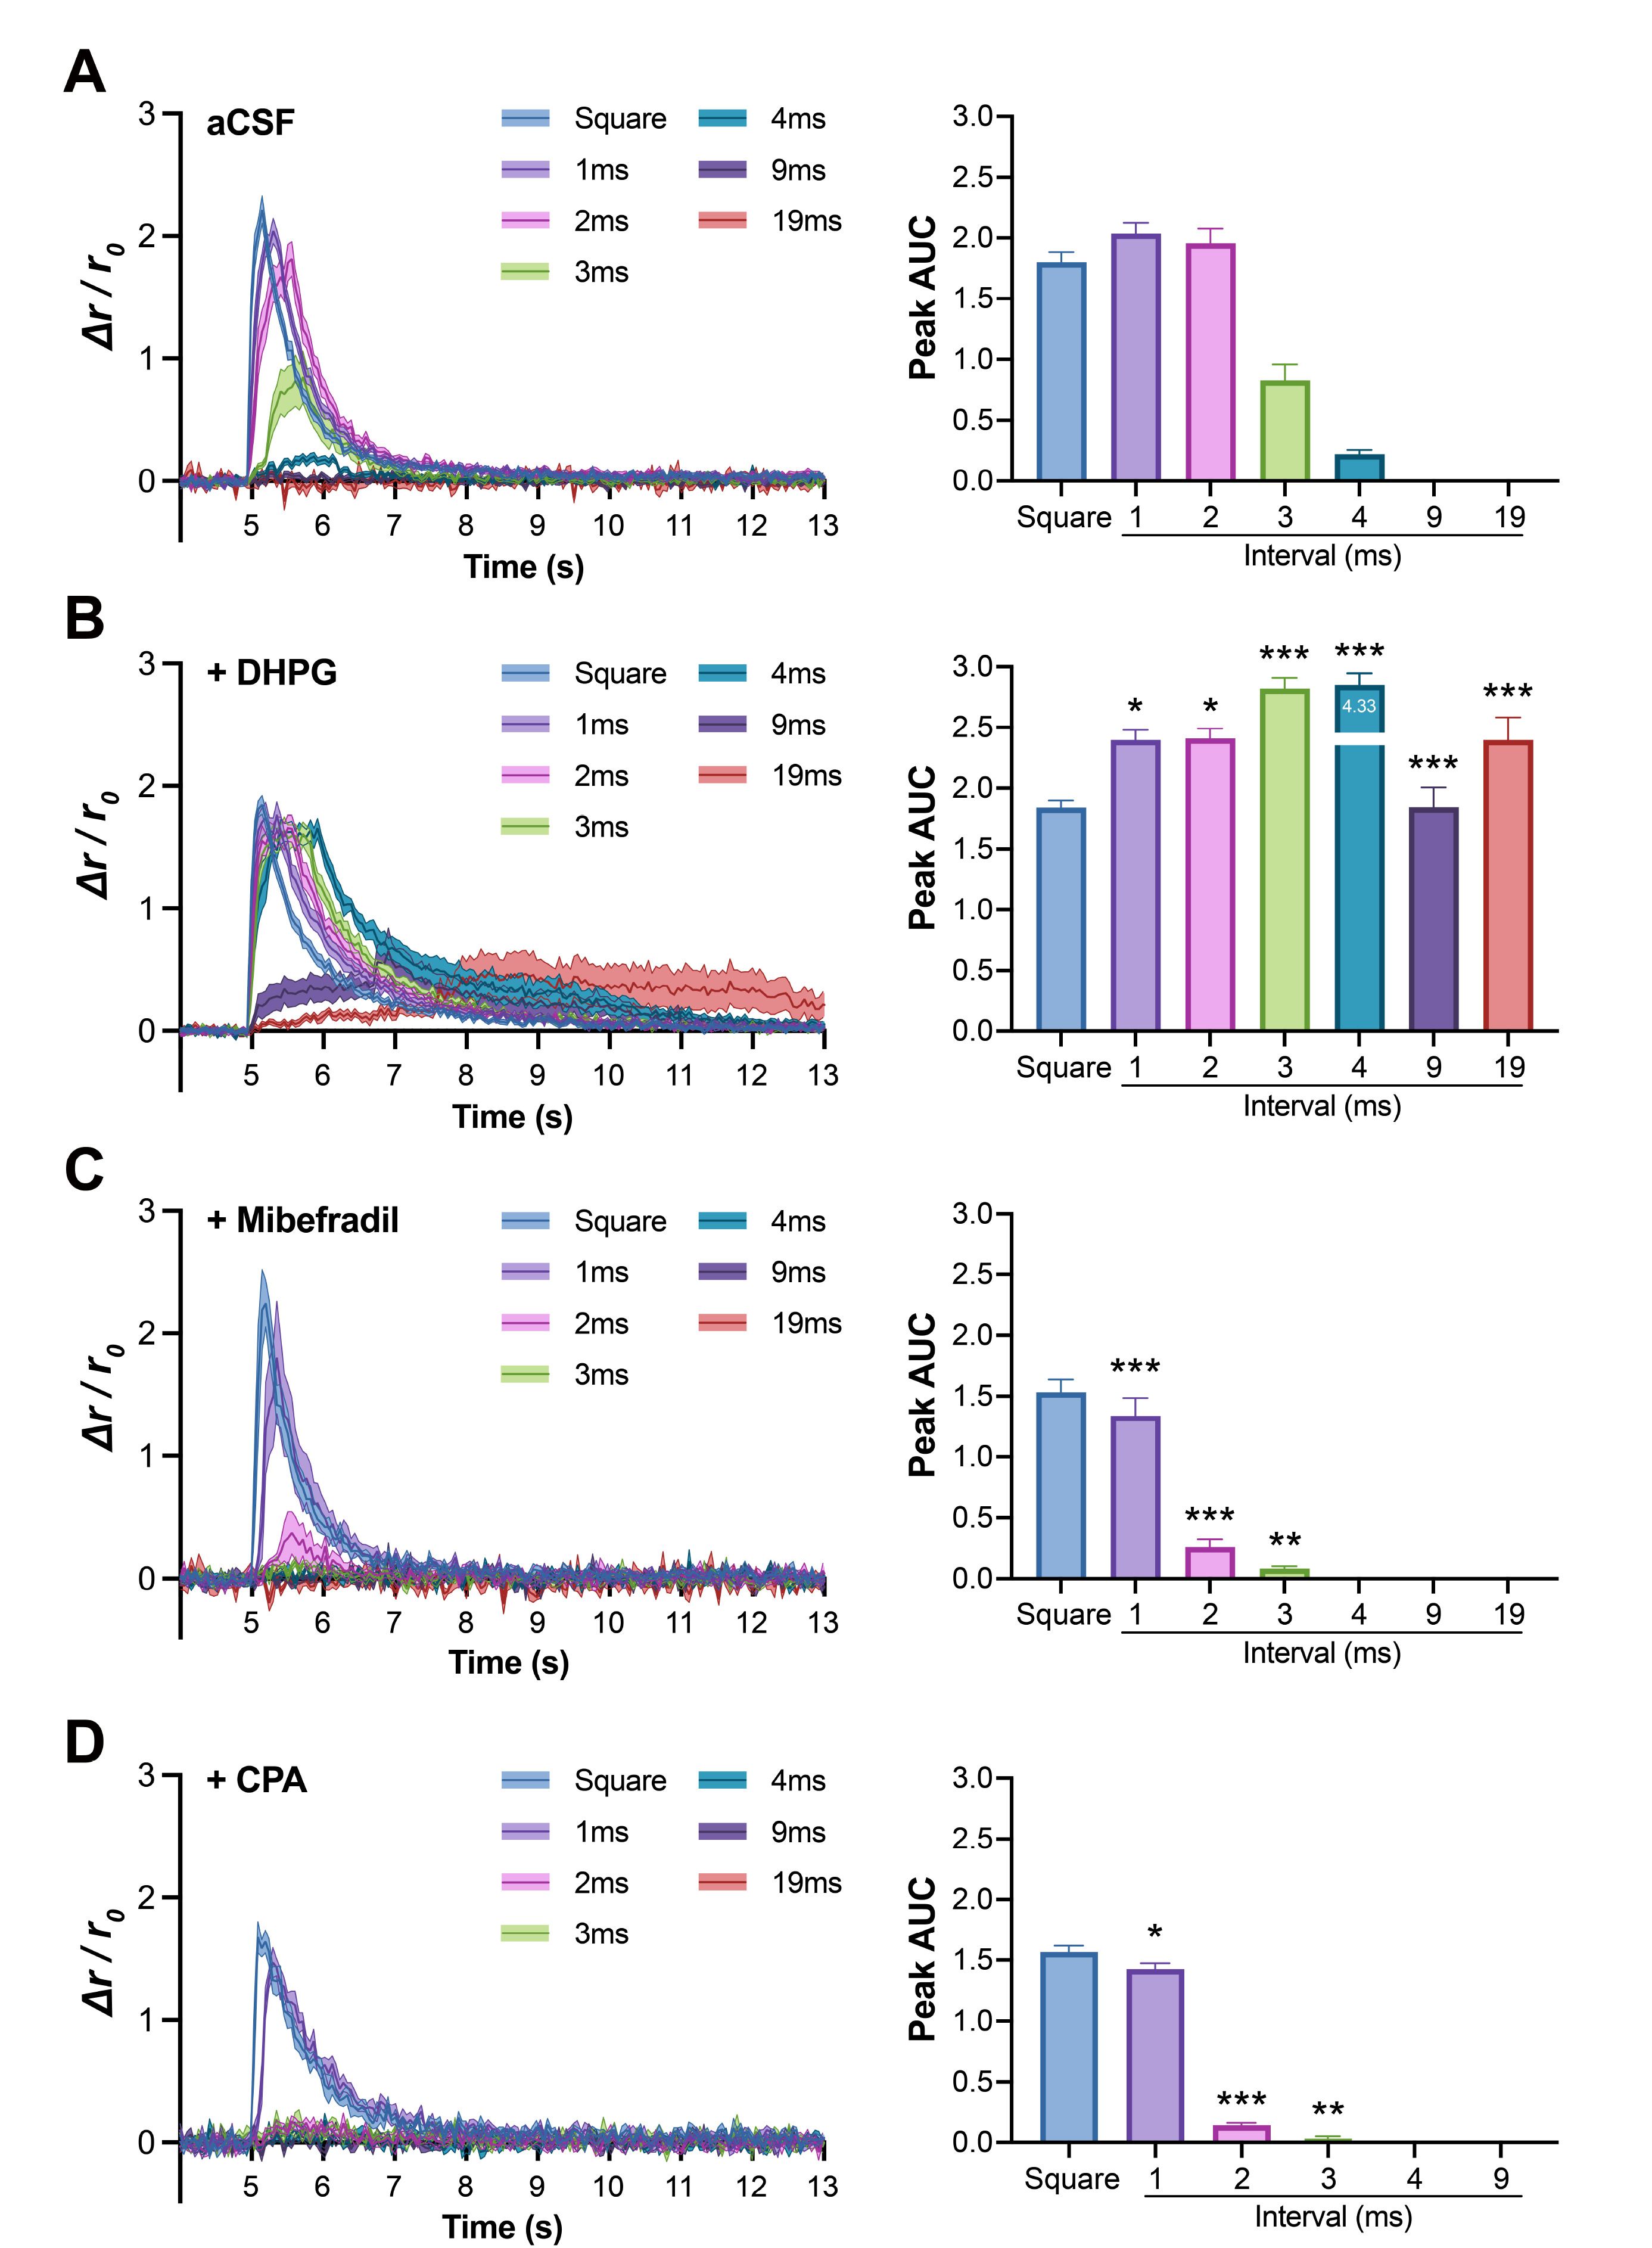
Fig. 3. The area under curves after drug treatment. (A) Ca2+ transient (left) and AUC (right) of normal aCSF group (n=25). (B) Ca2+ transient (left) and AUC (right) of the DHPG-treated group (n=16). The AUC at 1, 2, 3 and 4 ms interval stimulation were significantly larger than aCSF group (1 ms, p=0.011; 2 ms, p=0.013; 3 ms, p<0.001; 4 ms, p<0.001). At 9 and 19 ms interval stimulation, only the DHPG-treated group showed notable AUC. (C) Ca2+ transient (left) and AUC (right) of the Mibefradil-treated group (n=9). The AUC at 1, 2 and 3 ms interval stimulation were significantly smaller than aCSF group (1 ms, p<0.001; 2 ms, p<0.001; 3 ms, p=0.002). (D) Ca2+ transient (left) and AUC (right) of the CPA-treated group (n=5). The AUC at 1, 2 and 3 ms interval stimulation were significantly smaller than aCSF group (1 ms, p=0.012; 2 ms, p<0.001; 3 ms, p=0.008). Two-tailed t-test was used for all comparisons. Error bar indicates SEM. Statistical significance to the same interval stimulation of aCSF group *p<0.05, **p<0.01, ***p<0.001.
© Exp Neurobiol