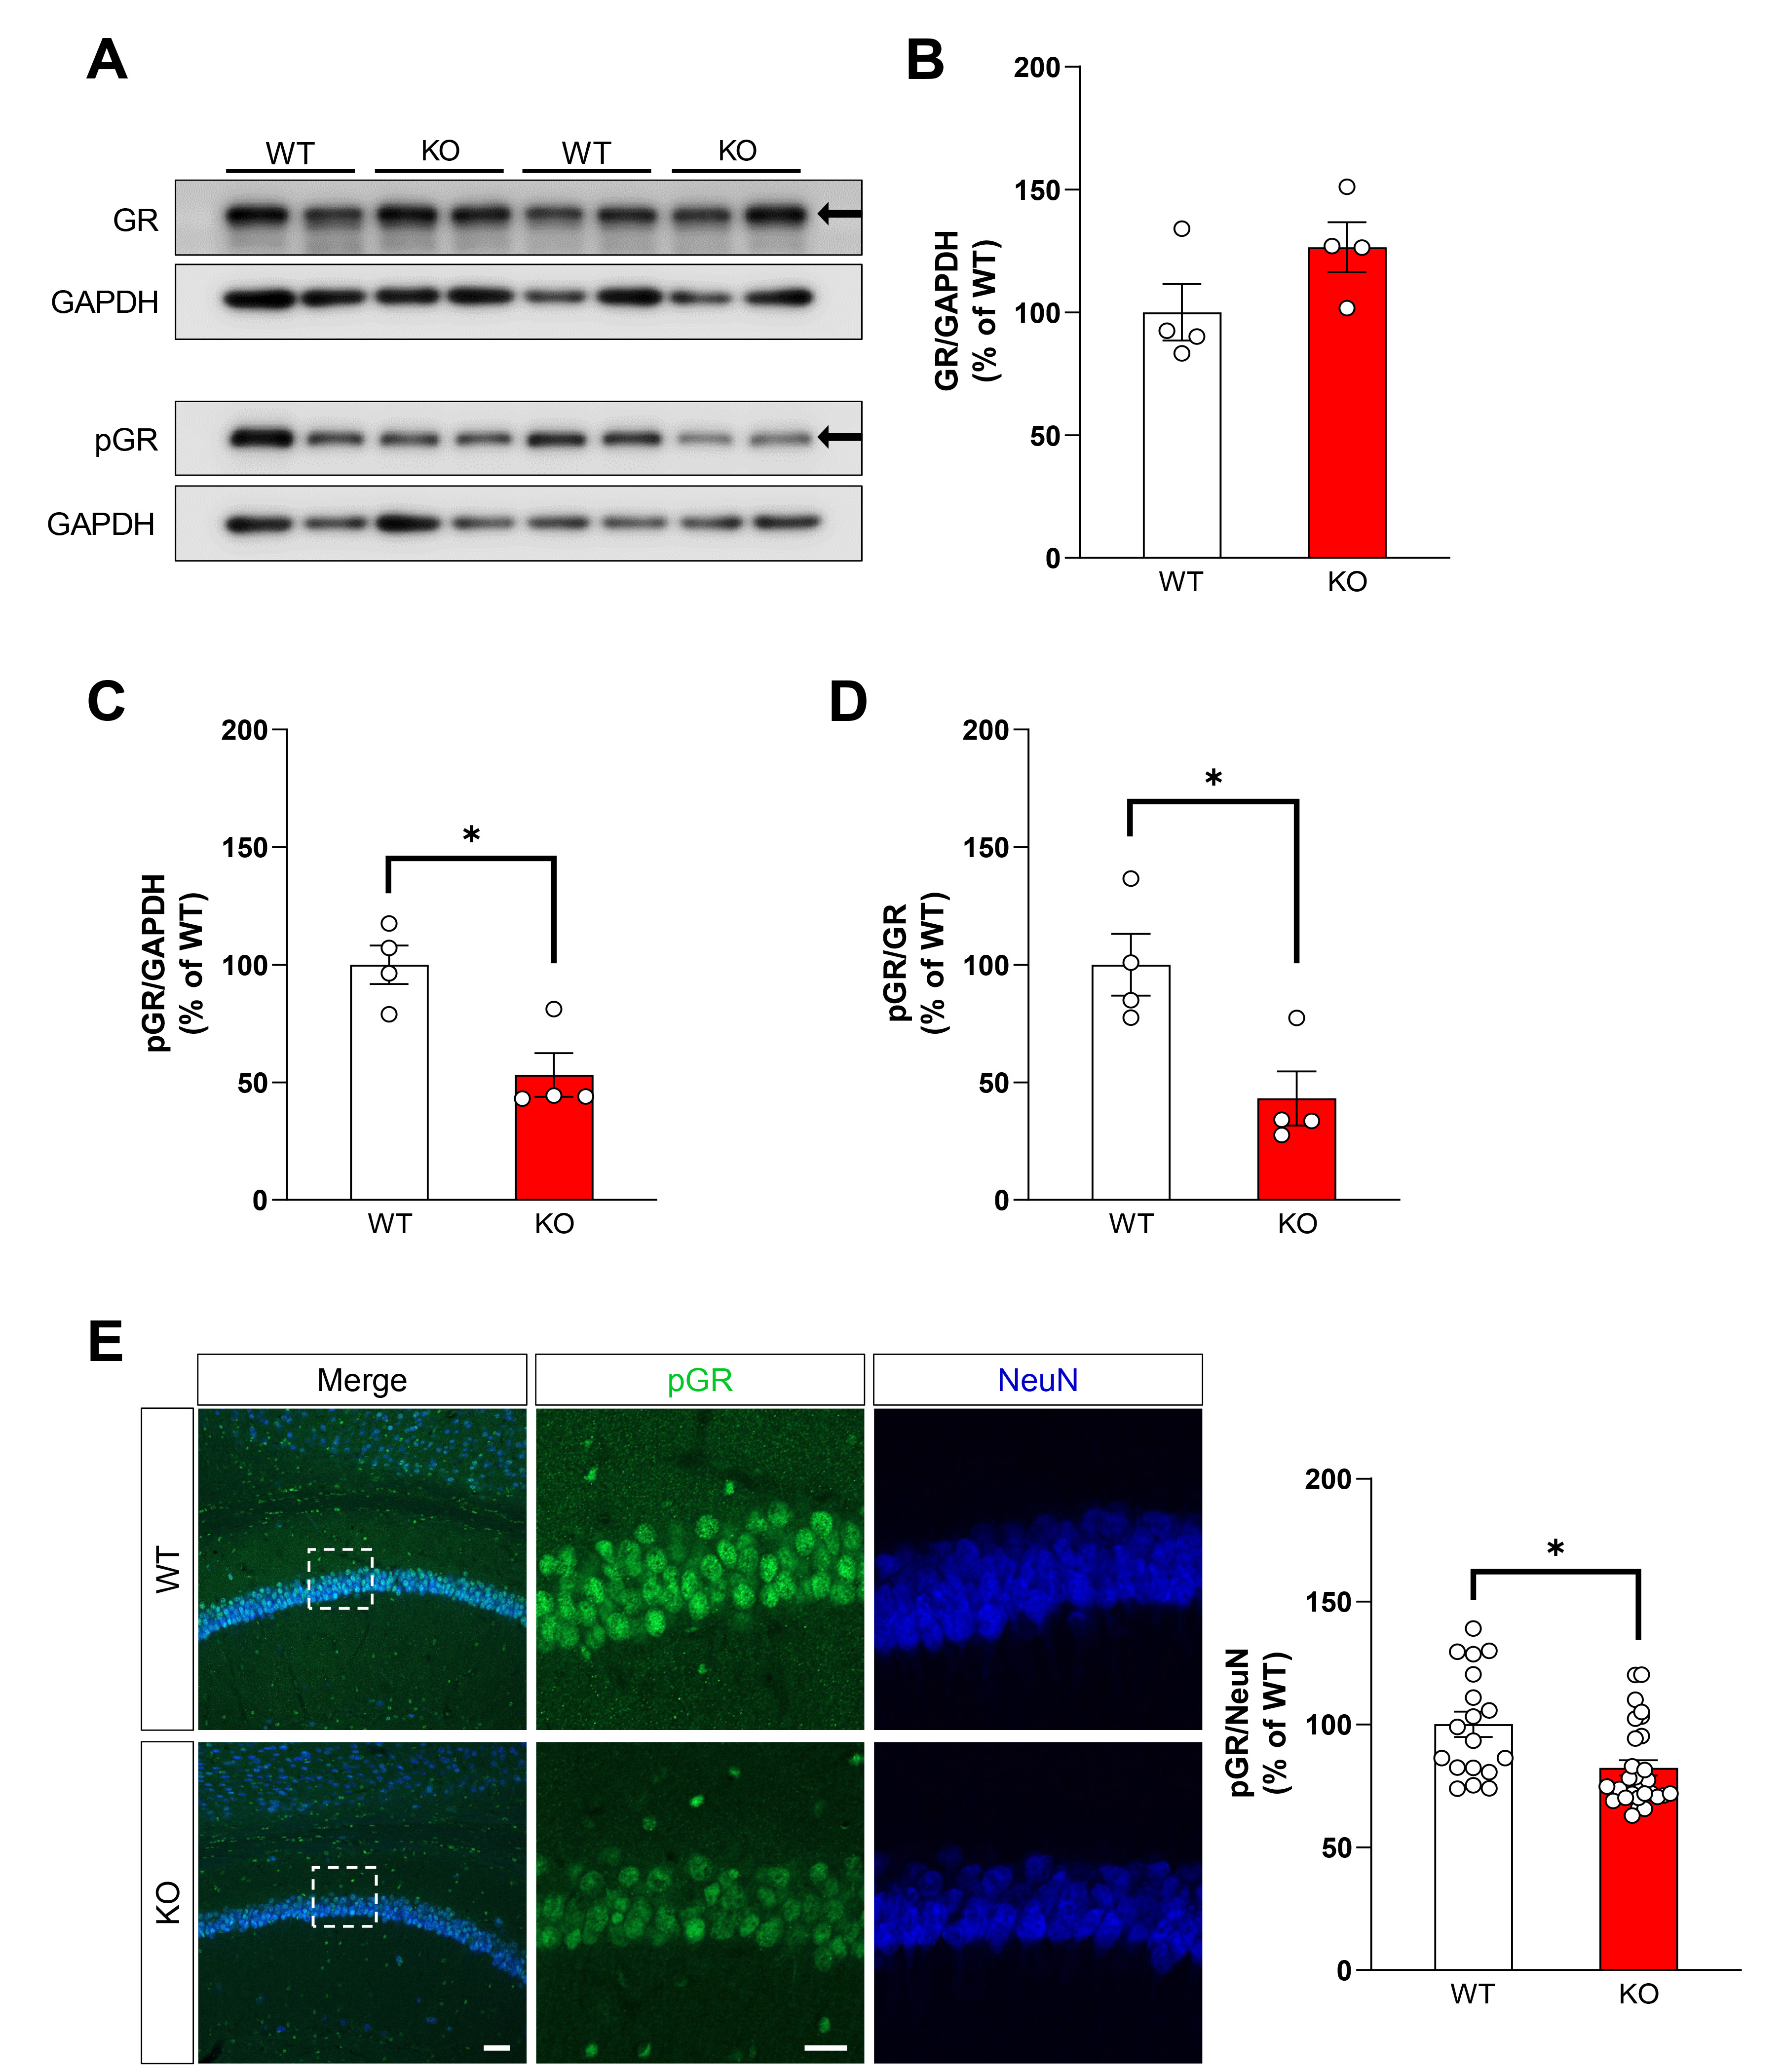
Fig. 3. Total GR and pGR S211 levels in non-stressed wild-type (WT) and Fkbp5-knockout (KO) mice. (A) Representative images of western blotting. (B) No differences in the total glucocorticoid receptor (GR) levels in the hippocampus (n=4 per group) were observed between groups (C, D). Hippocampal phosphorylated GR at S211 (pGR) levels were lower in KO mice than in WT mice. (E) Images showing pGR-positive (middle) and NeuN-positive signals (right) in the hippocampus of WT and KO mice. Hippocampal pGR-positive signals were lower in KO mice (n=29) than in WT mice (n=18). Scale bar: 50 µm (bottom left) and 20 µm (bottom middle). *, p<0.05. Arrows indicate the band to be quantified.
© Exp Neurobiol