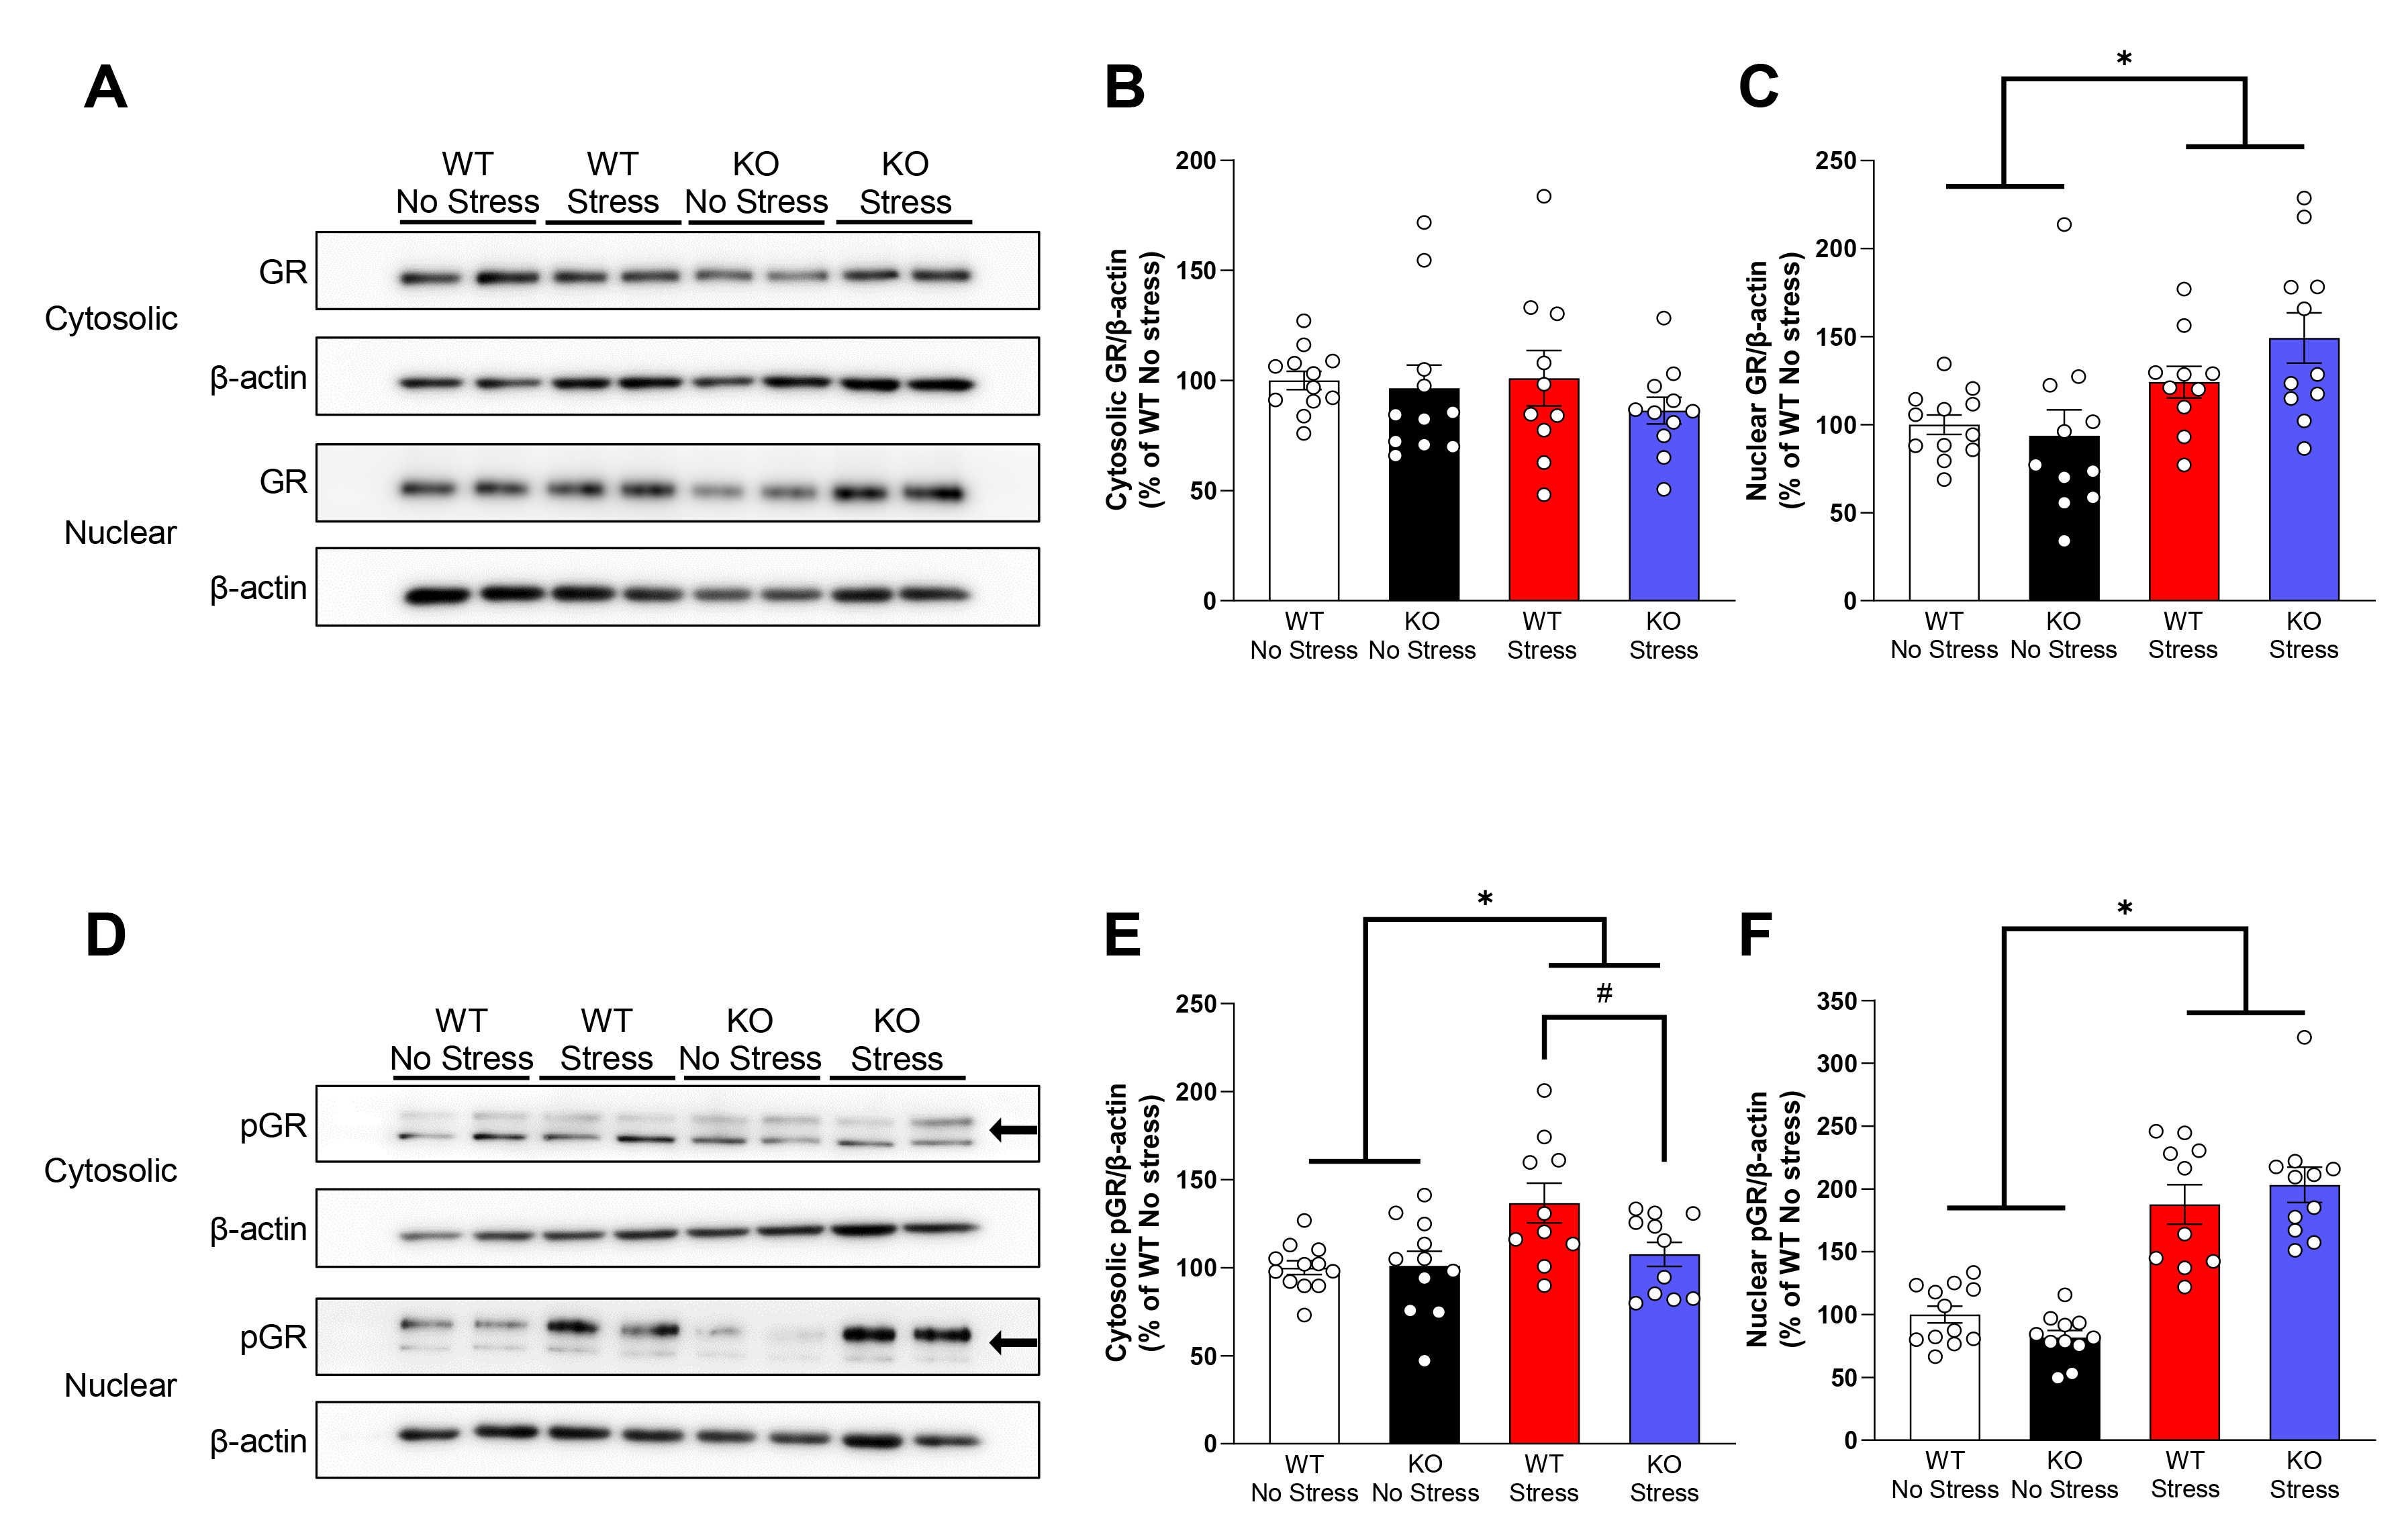
Fig. 5. Hippocampal cytosolic and nuclear expression of GR and pGR in wild-type and Fkbp5-knockout mice. (A) Western blot images of cytosolic and nuclear glucocorticoid receptors (GR) in wild-type (WT) and Fkbp5-knockout (KO) mice. (B) No differences in cytosolic GR levels between the groups were observed. (C) WT and KO mice following stress exhibited increased levels of nuclear GR. (D) Western blot images of cytosolic and nuclear phosphorylated GR at S211 (pGR) in WT and KO mice. (E) Cytosolic pGR levels were significantly increased following stress in the WT and KO mice (*, p<0.05) , but stress-induced increases in cytosolic pGR levels were observed in WT mice but not in KO mice (#, p<0.05). (F) Nuclear pGR levels were significantly increased after stress in the WT and KO mice (*), WT no stress (n=12), WT stress (n=10), KO no stress (n=11), KO stress (n=11). Arrows indicate the bands to be quantified.
© Exp Neurobiol