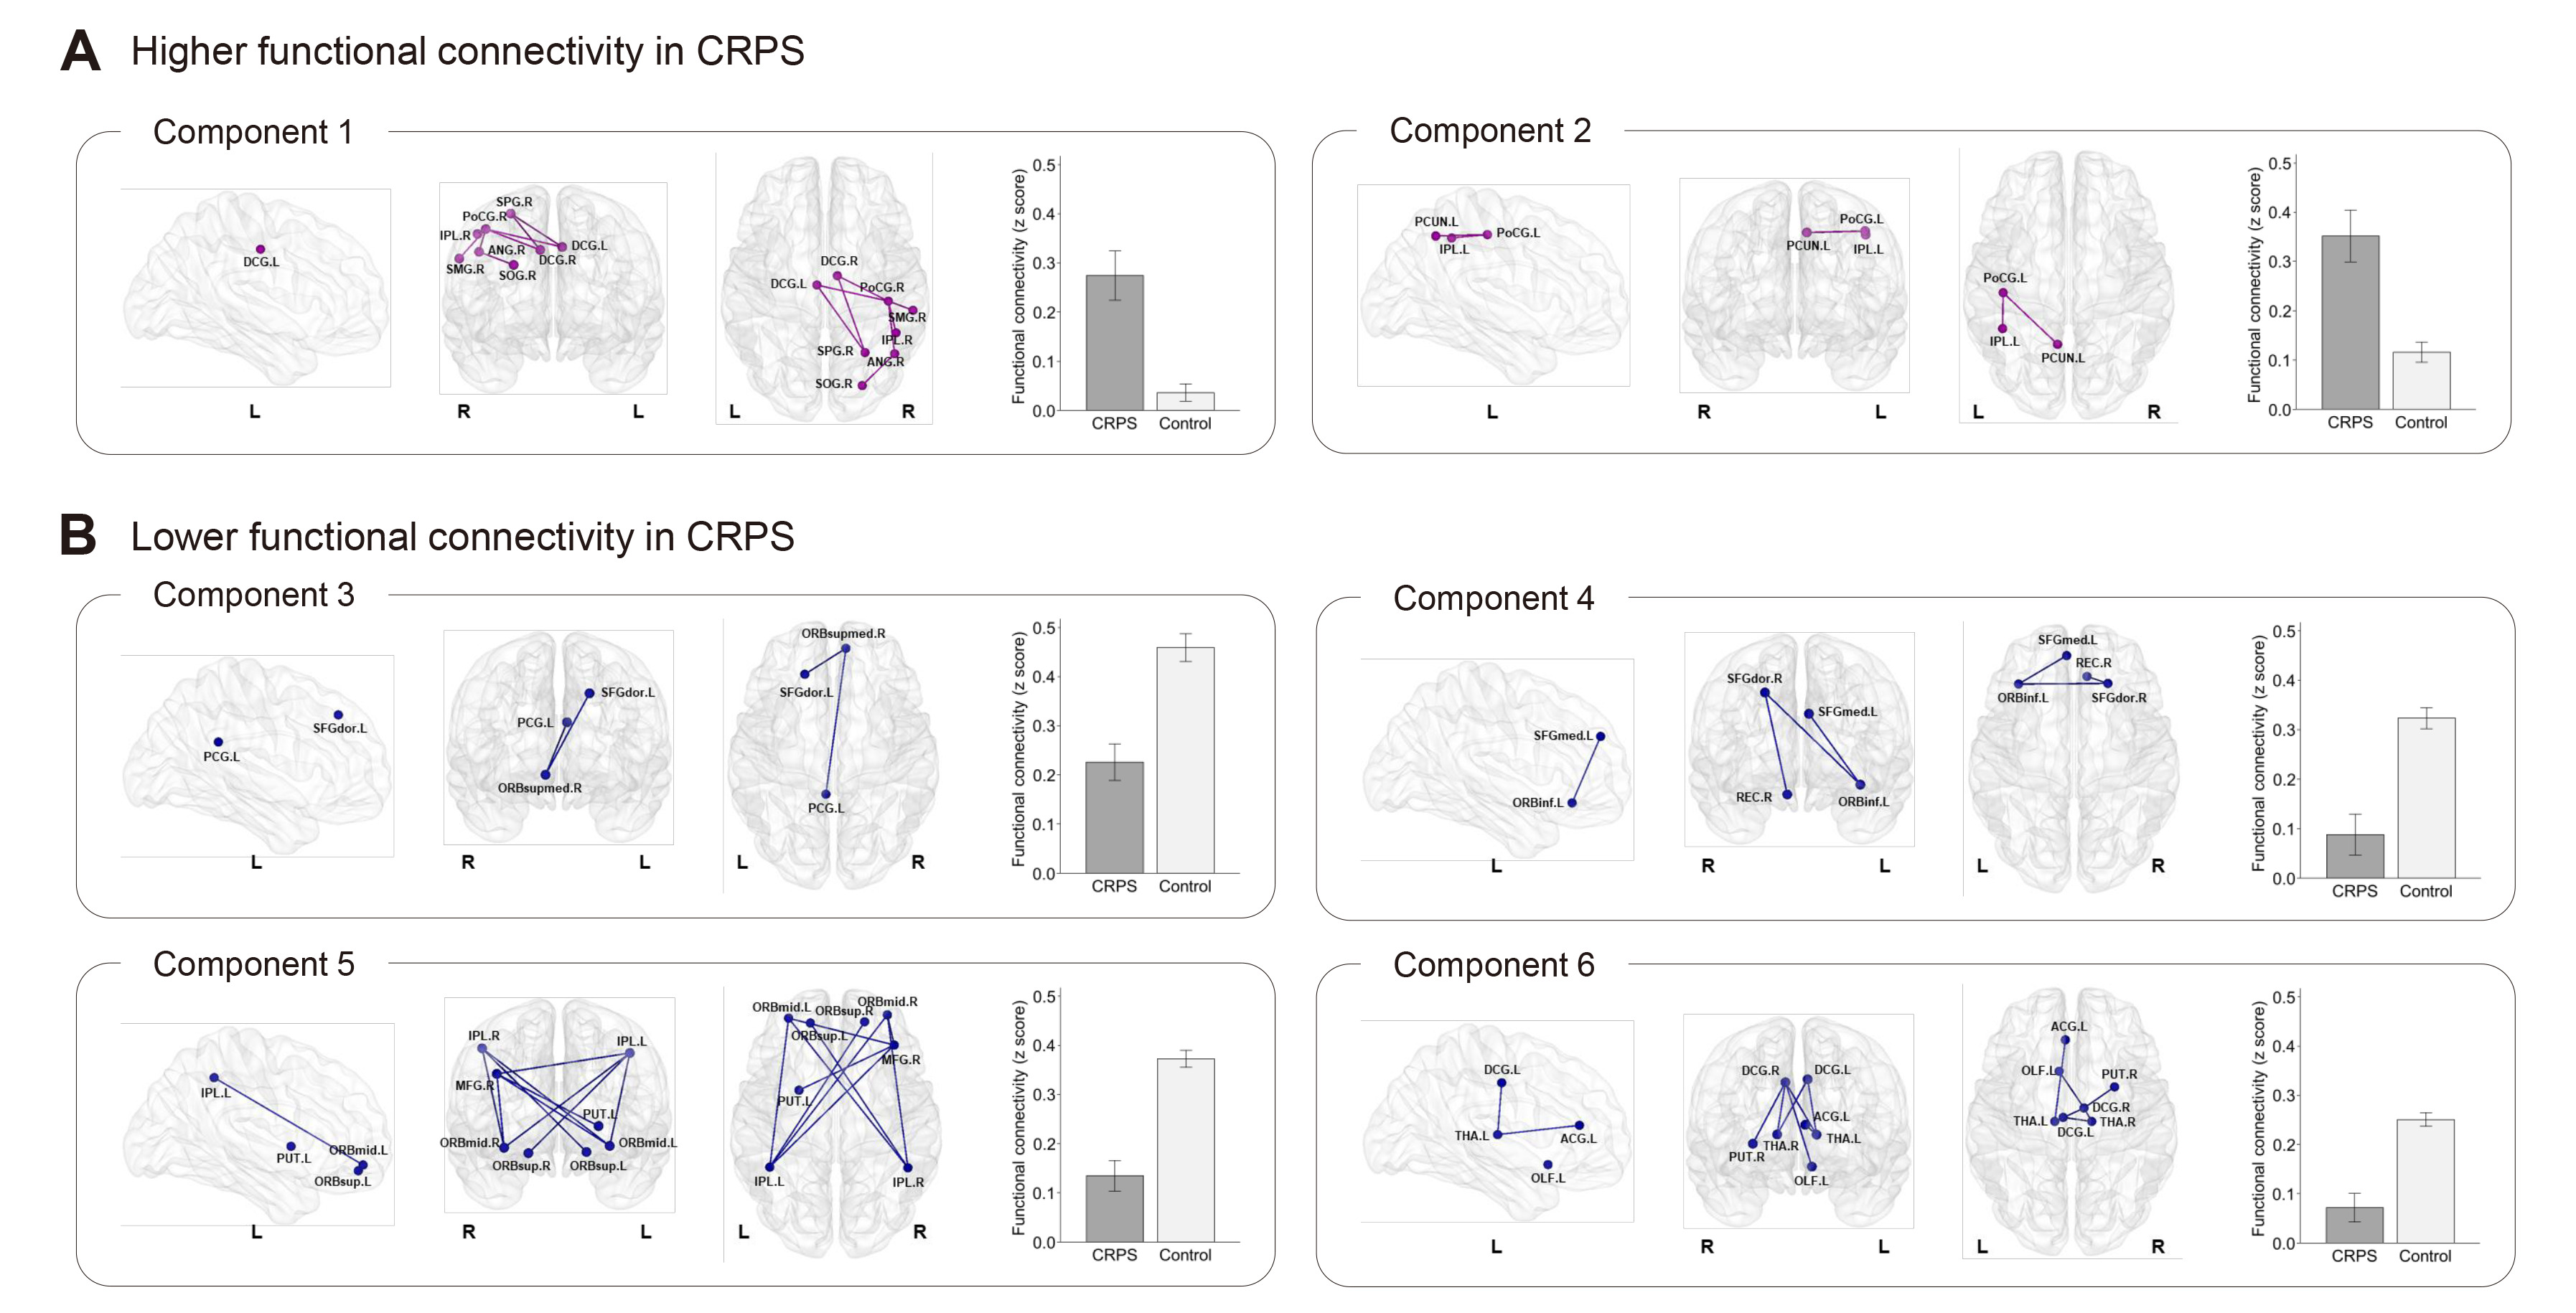
Fig. 1. Network components showing significant differences in functional connectivity between CRPS patients and healthy controls. Network components showing (A) higher or (B) lower functional connectivity in CRPS patients compared to healthy controls were identified using Network-based Statistics analysis. The initial cluster-defining threshold was set at t=4.0, and 5,000 permutations were performed to identify network components with p<0.05 corrected for family-wise error based on their size. The pairs of the brain regions with increased functional connectivity and decreased functional connectivity are indicated with the red and blue lines, respectively. The bar graphs indicate the average functional connectivity within each network component for the CRPS and control groups. The error bars represent standard error of the mean. ACG, anterior cingulate gyrus; ANG, angular gyrus; CRPS, complex regional pain syndrome; DCG, median cingulate gyrus; IPL, inferior parietal gyrus; L, left; MFG, middle frontal gyrus; OLF, olfactory cortex; ORBinf, inferior frontal gyrus (orbital); ORBmid, middle frontal gyrus (orbital); ORBsup, superior frontal gyrus (orbital); ORBsupmed, superior frontal gyrus (medial orbital); PCG, posterior cingulate gyrus; PCUN, precuneus; PoCG, postcentral gyrus; PUT, putamen; R, right; REC, gyrus rectus; SFGdor, superior frontal gyrus (dorsolateral); SFGmed, superior frontal gyrus (medial); SMG, supramarginal gyrus; SOG, superior occipital gyrus; SPG, superior parietal gyrus; THA, thalamus.
© Exp Neurobiol