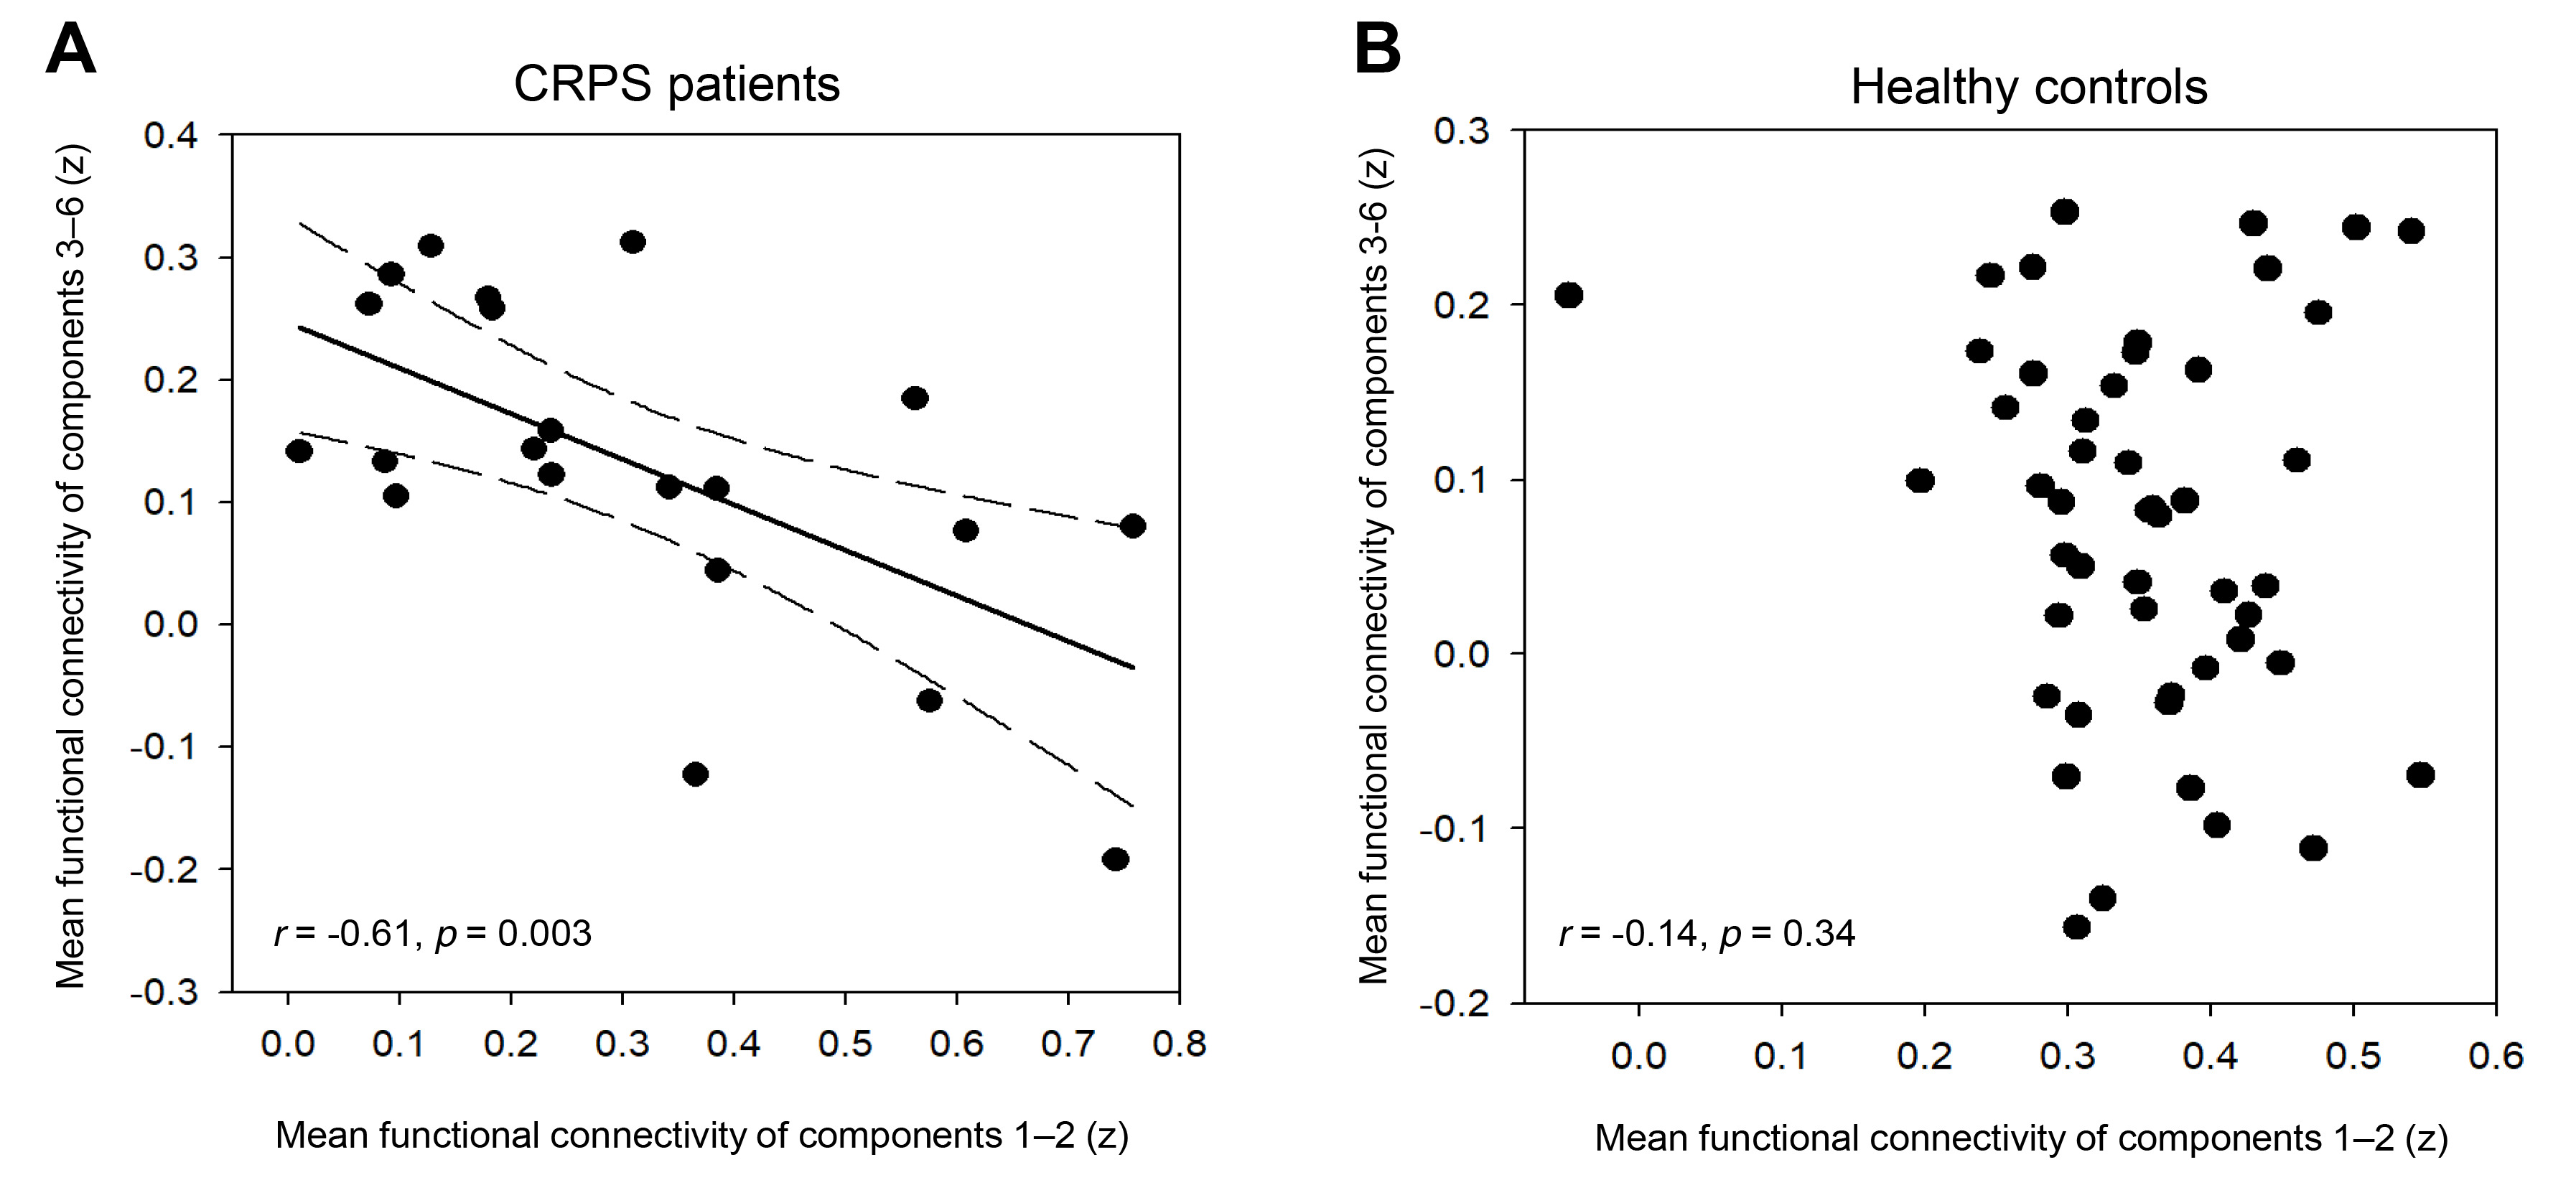
Fig. 3. Differential connections between subnetworks with CRPS-related higher (components 1~2) and lower functional connectivity (components 3~6) in (A) CRPS patients and (B) healthy controls. The solid line indicates the line of best fit, and the dashed lines indicate the 95% confidence intervals. CRPS, complex regional pain syndrome.
© Exp Neurobiol