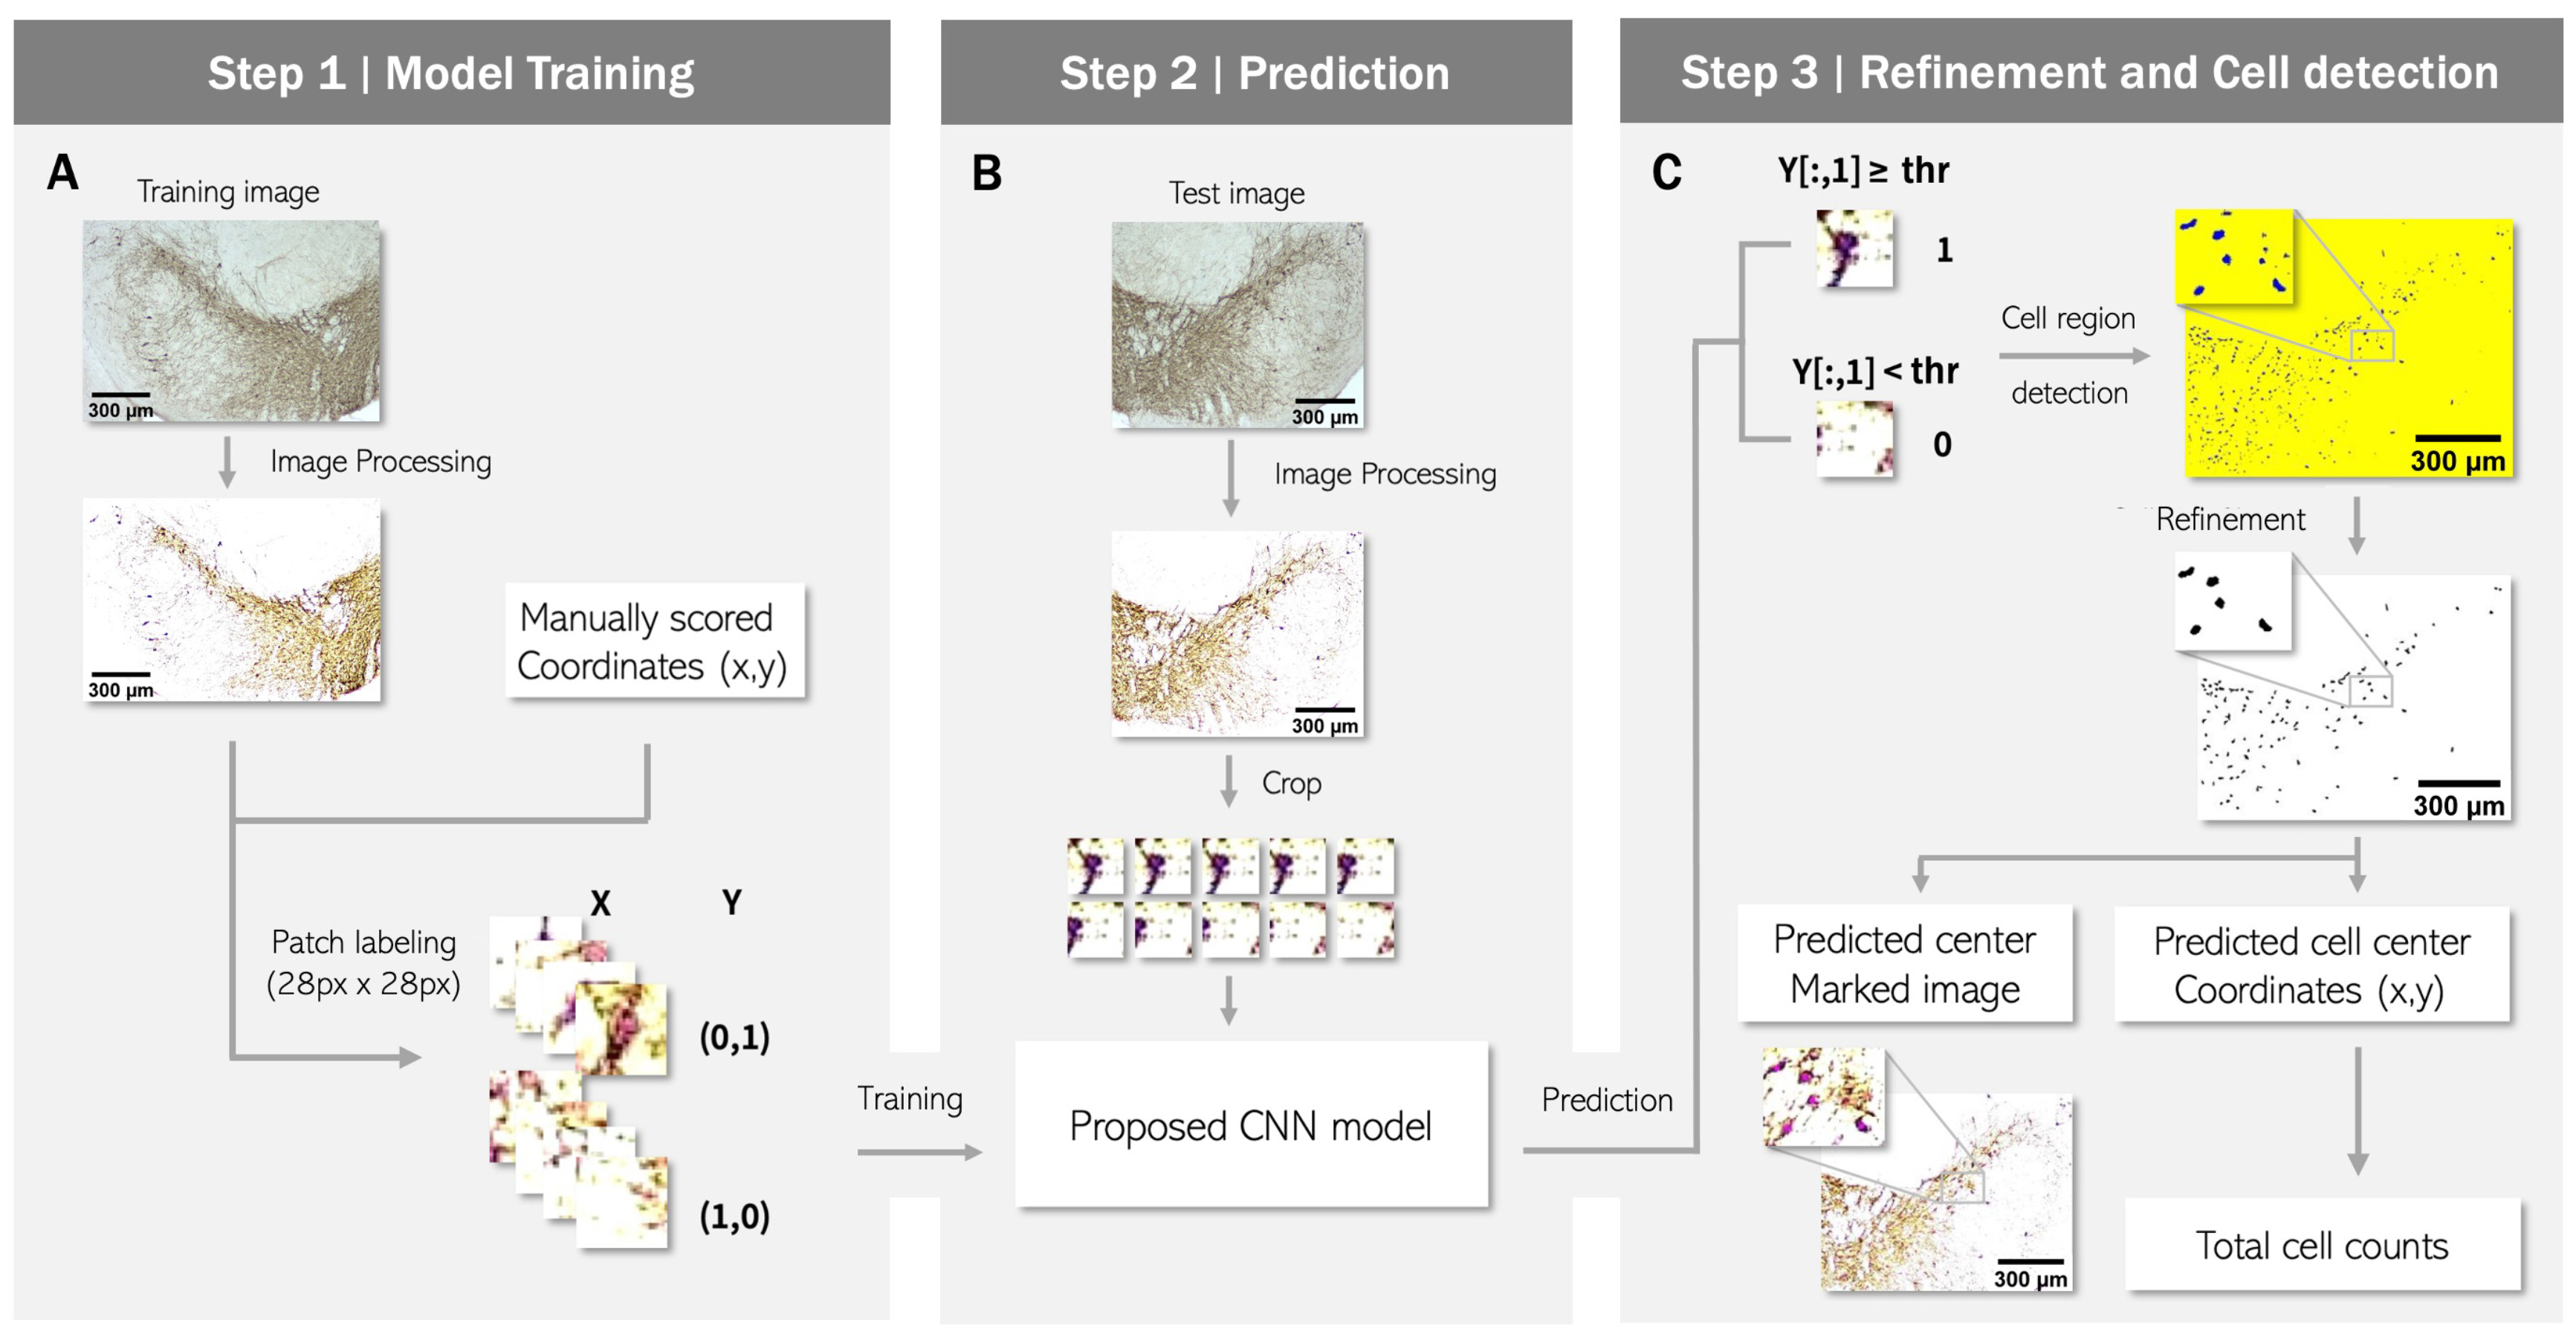
Fig. 1. A flowchart of the proposed TH+ neuron detection algorithm. (A) Data preprocessing and model training. Training images were preprocessed using PIL.ImageEnhance (36<σ<40, 240<μ<255, mode=255). With manual scoring results, annotated patches were generated as positive labels, and the surrounding patches were randomly extracted and generated as negative labels. The model was trained with these patches. (B) Prediction. After inputting 28×28 pixel-sized patches created from a test image, the model evaluated every patch. (C) Refinement and cell detection. As a result of prediction, a binary image was produced based on whether the predicted value of each pixel exceeded the set threshold. The last phase was refinement of the binary image with cv2.findContours.
© Exp Neurobiol