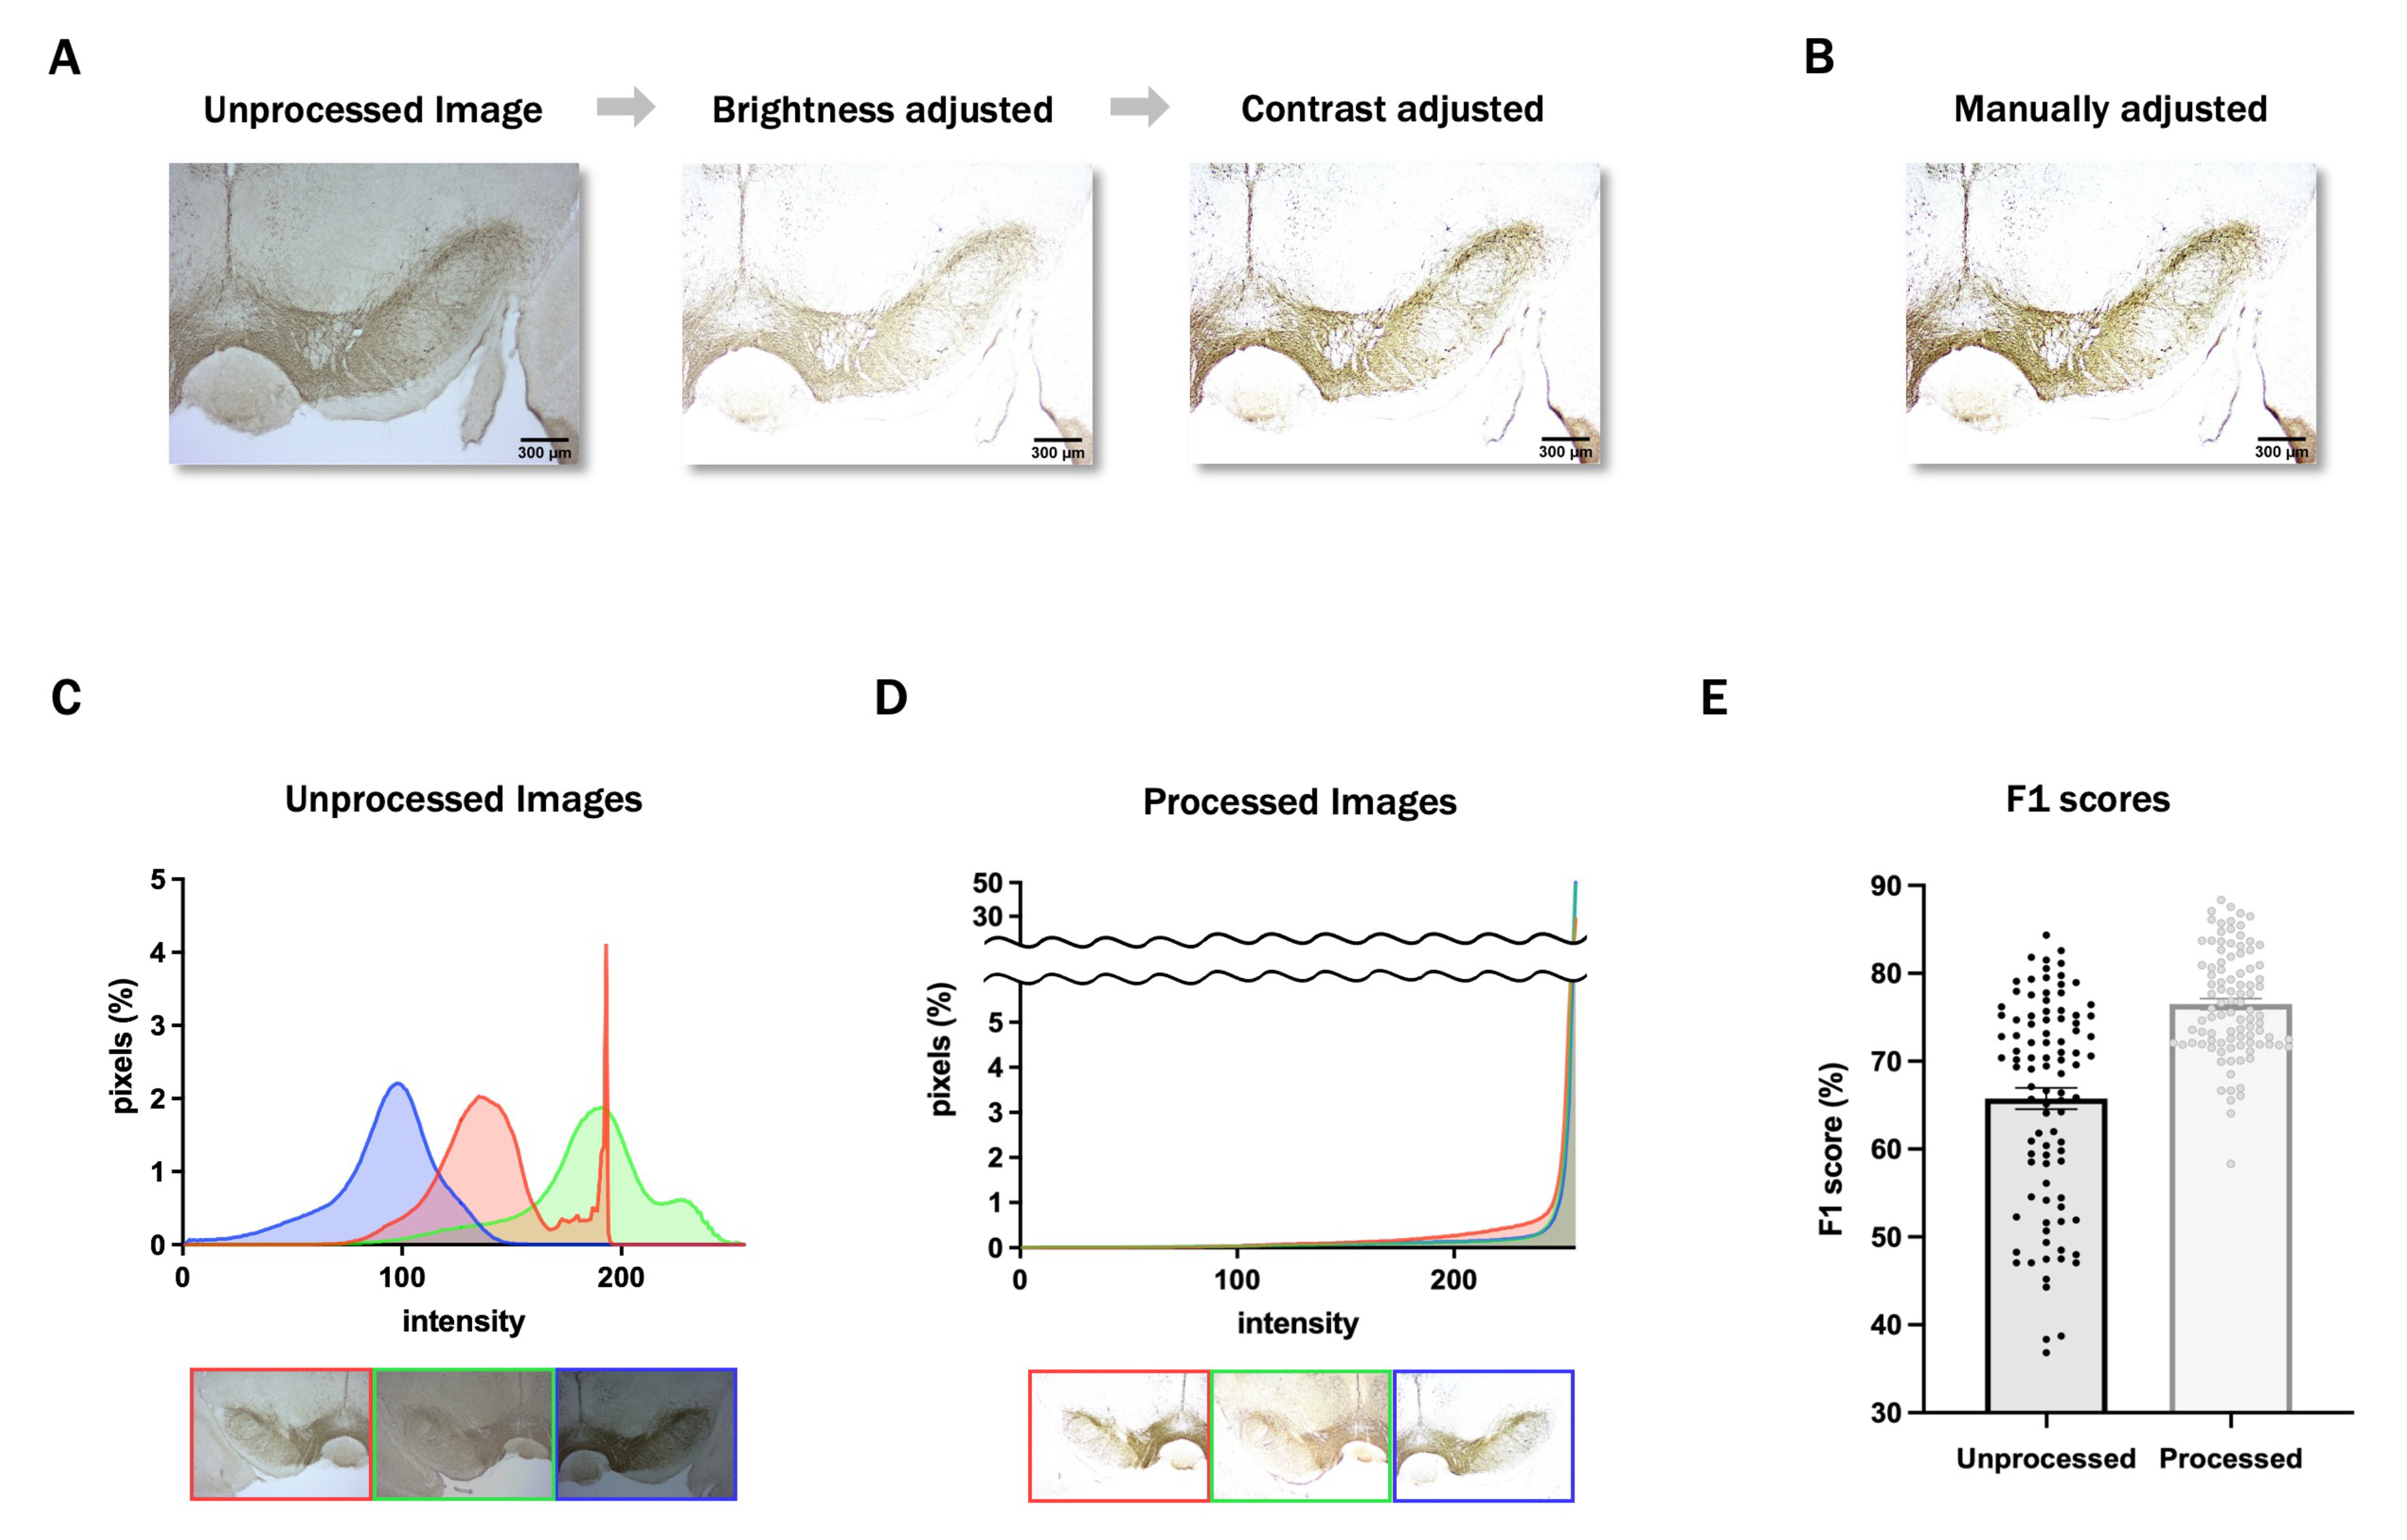
Fig. 3. Image preprocessing. (A) The proposed image preprocessing process and results of each step. (B) A manually edited image of the unprocessed image in A. The intensity distribution (IDB) of the images (C) before and (D) after the preprocessing phase. X values indicate intensities. The minimum intensity is 0 (black), and the maximum intensity is 255 (white). Y values indicate the number of pixels with each intensity in percentage (%). Each graph represents the IDB of the image on the left with a border of the same color. (E) F1 scores before and after the image preprocessing.
© Exp Neurobiol