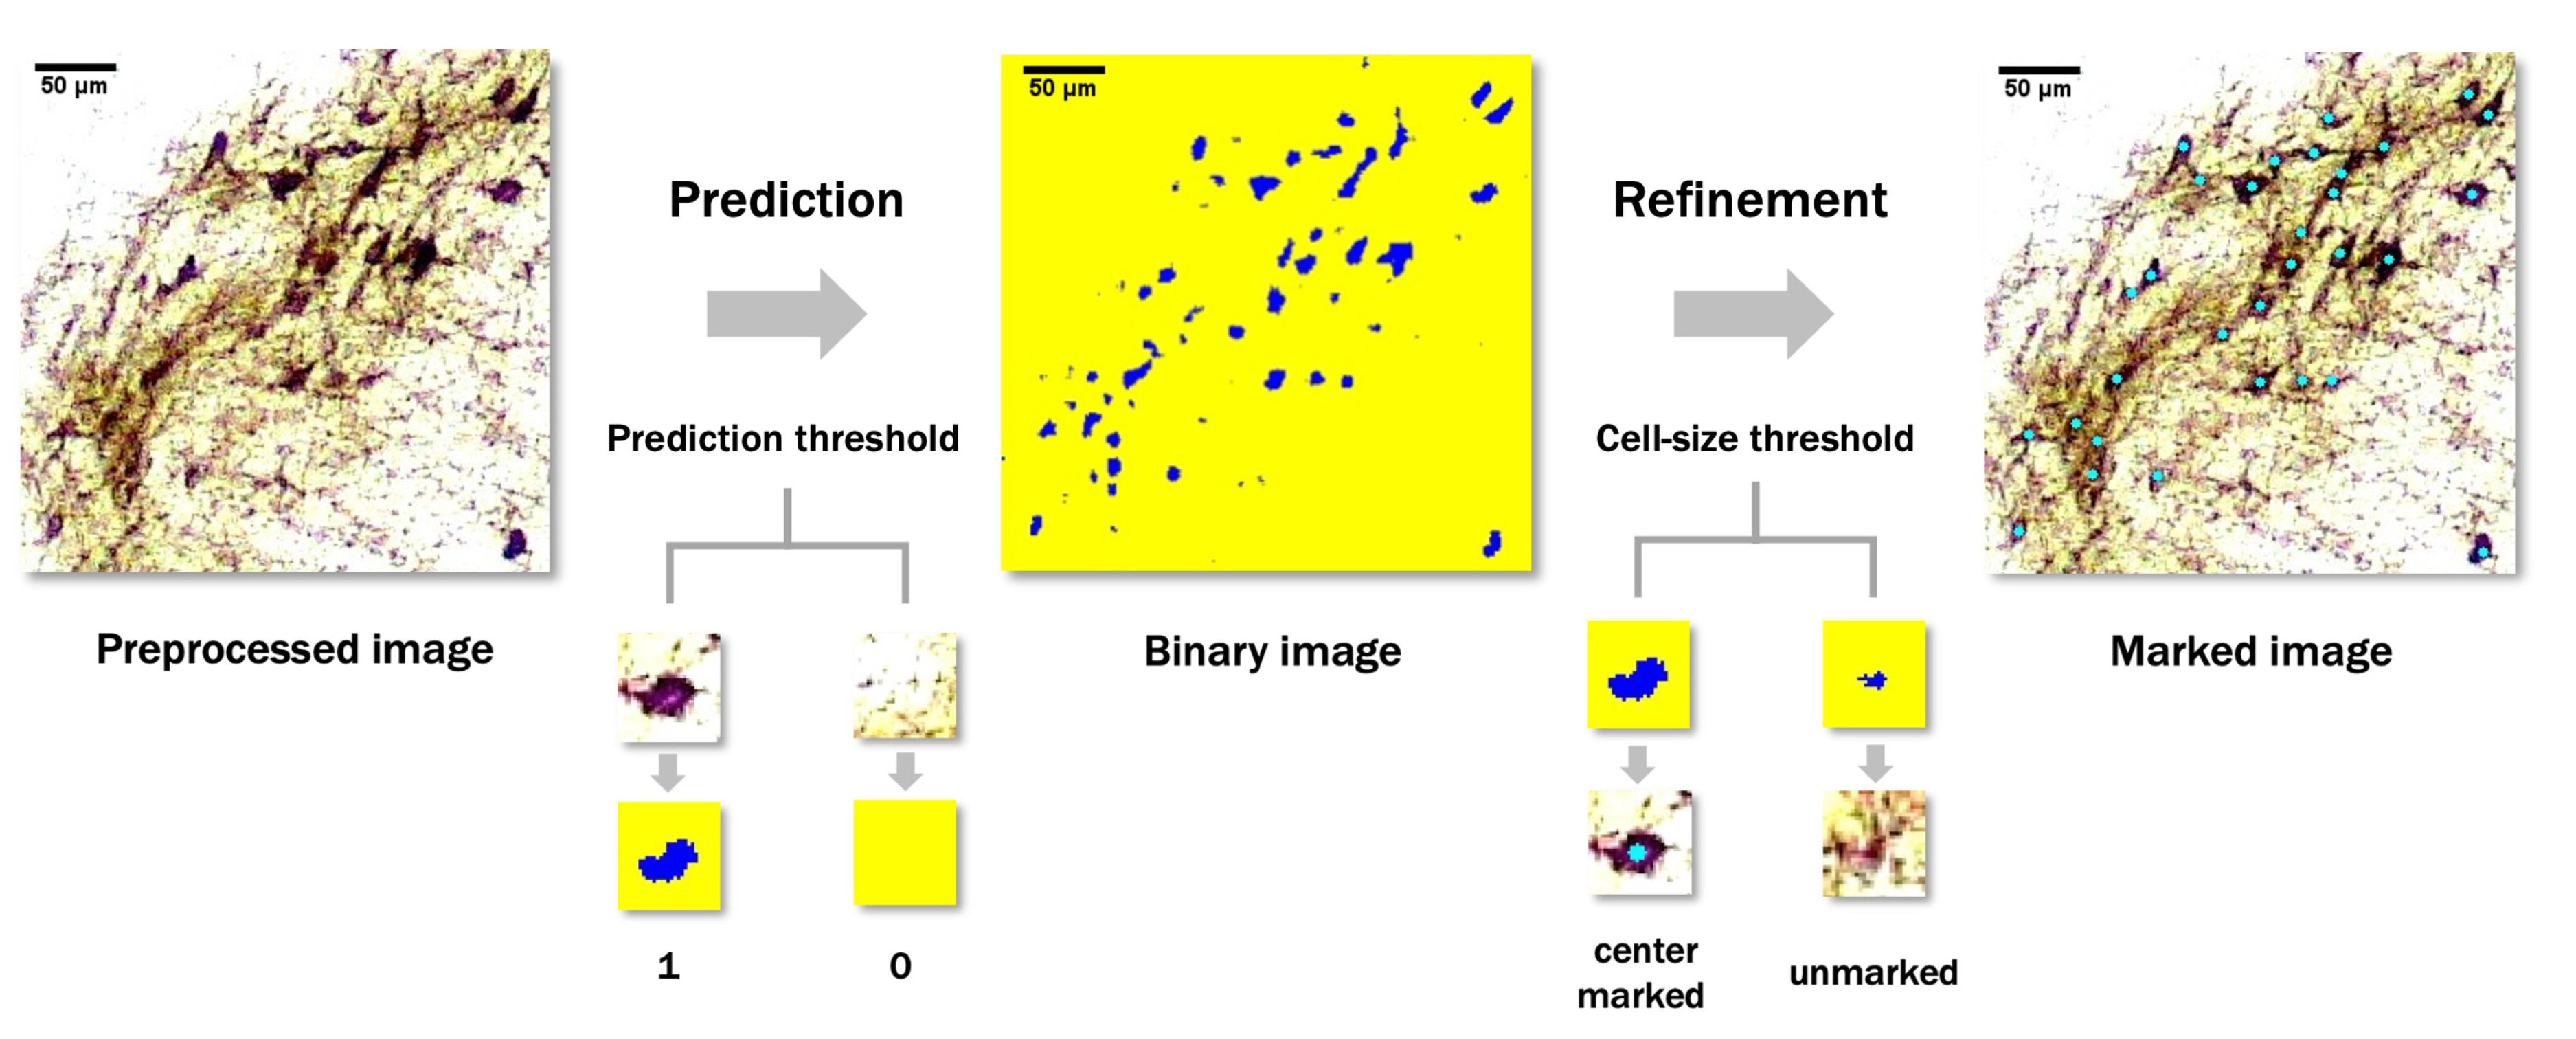
Fig. 4. Cell detection. Prediction: The CNN model evaluated each input patch. If the model prediction results exceeded the prediction threshold, the center pixels of the patches were labeled. Refinement: Only detected areas with size exceeding the threshold were retained. Markers were labeled at the center of the remaining blobs. From the labeling results and original input image, an annotated image was assembled.
© Exp Neurobiol