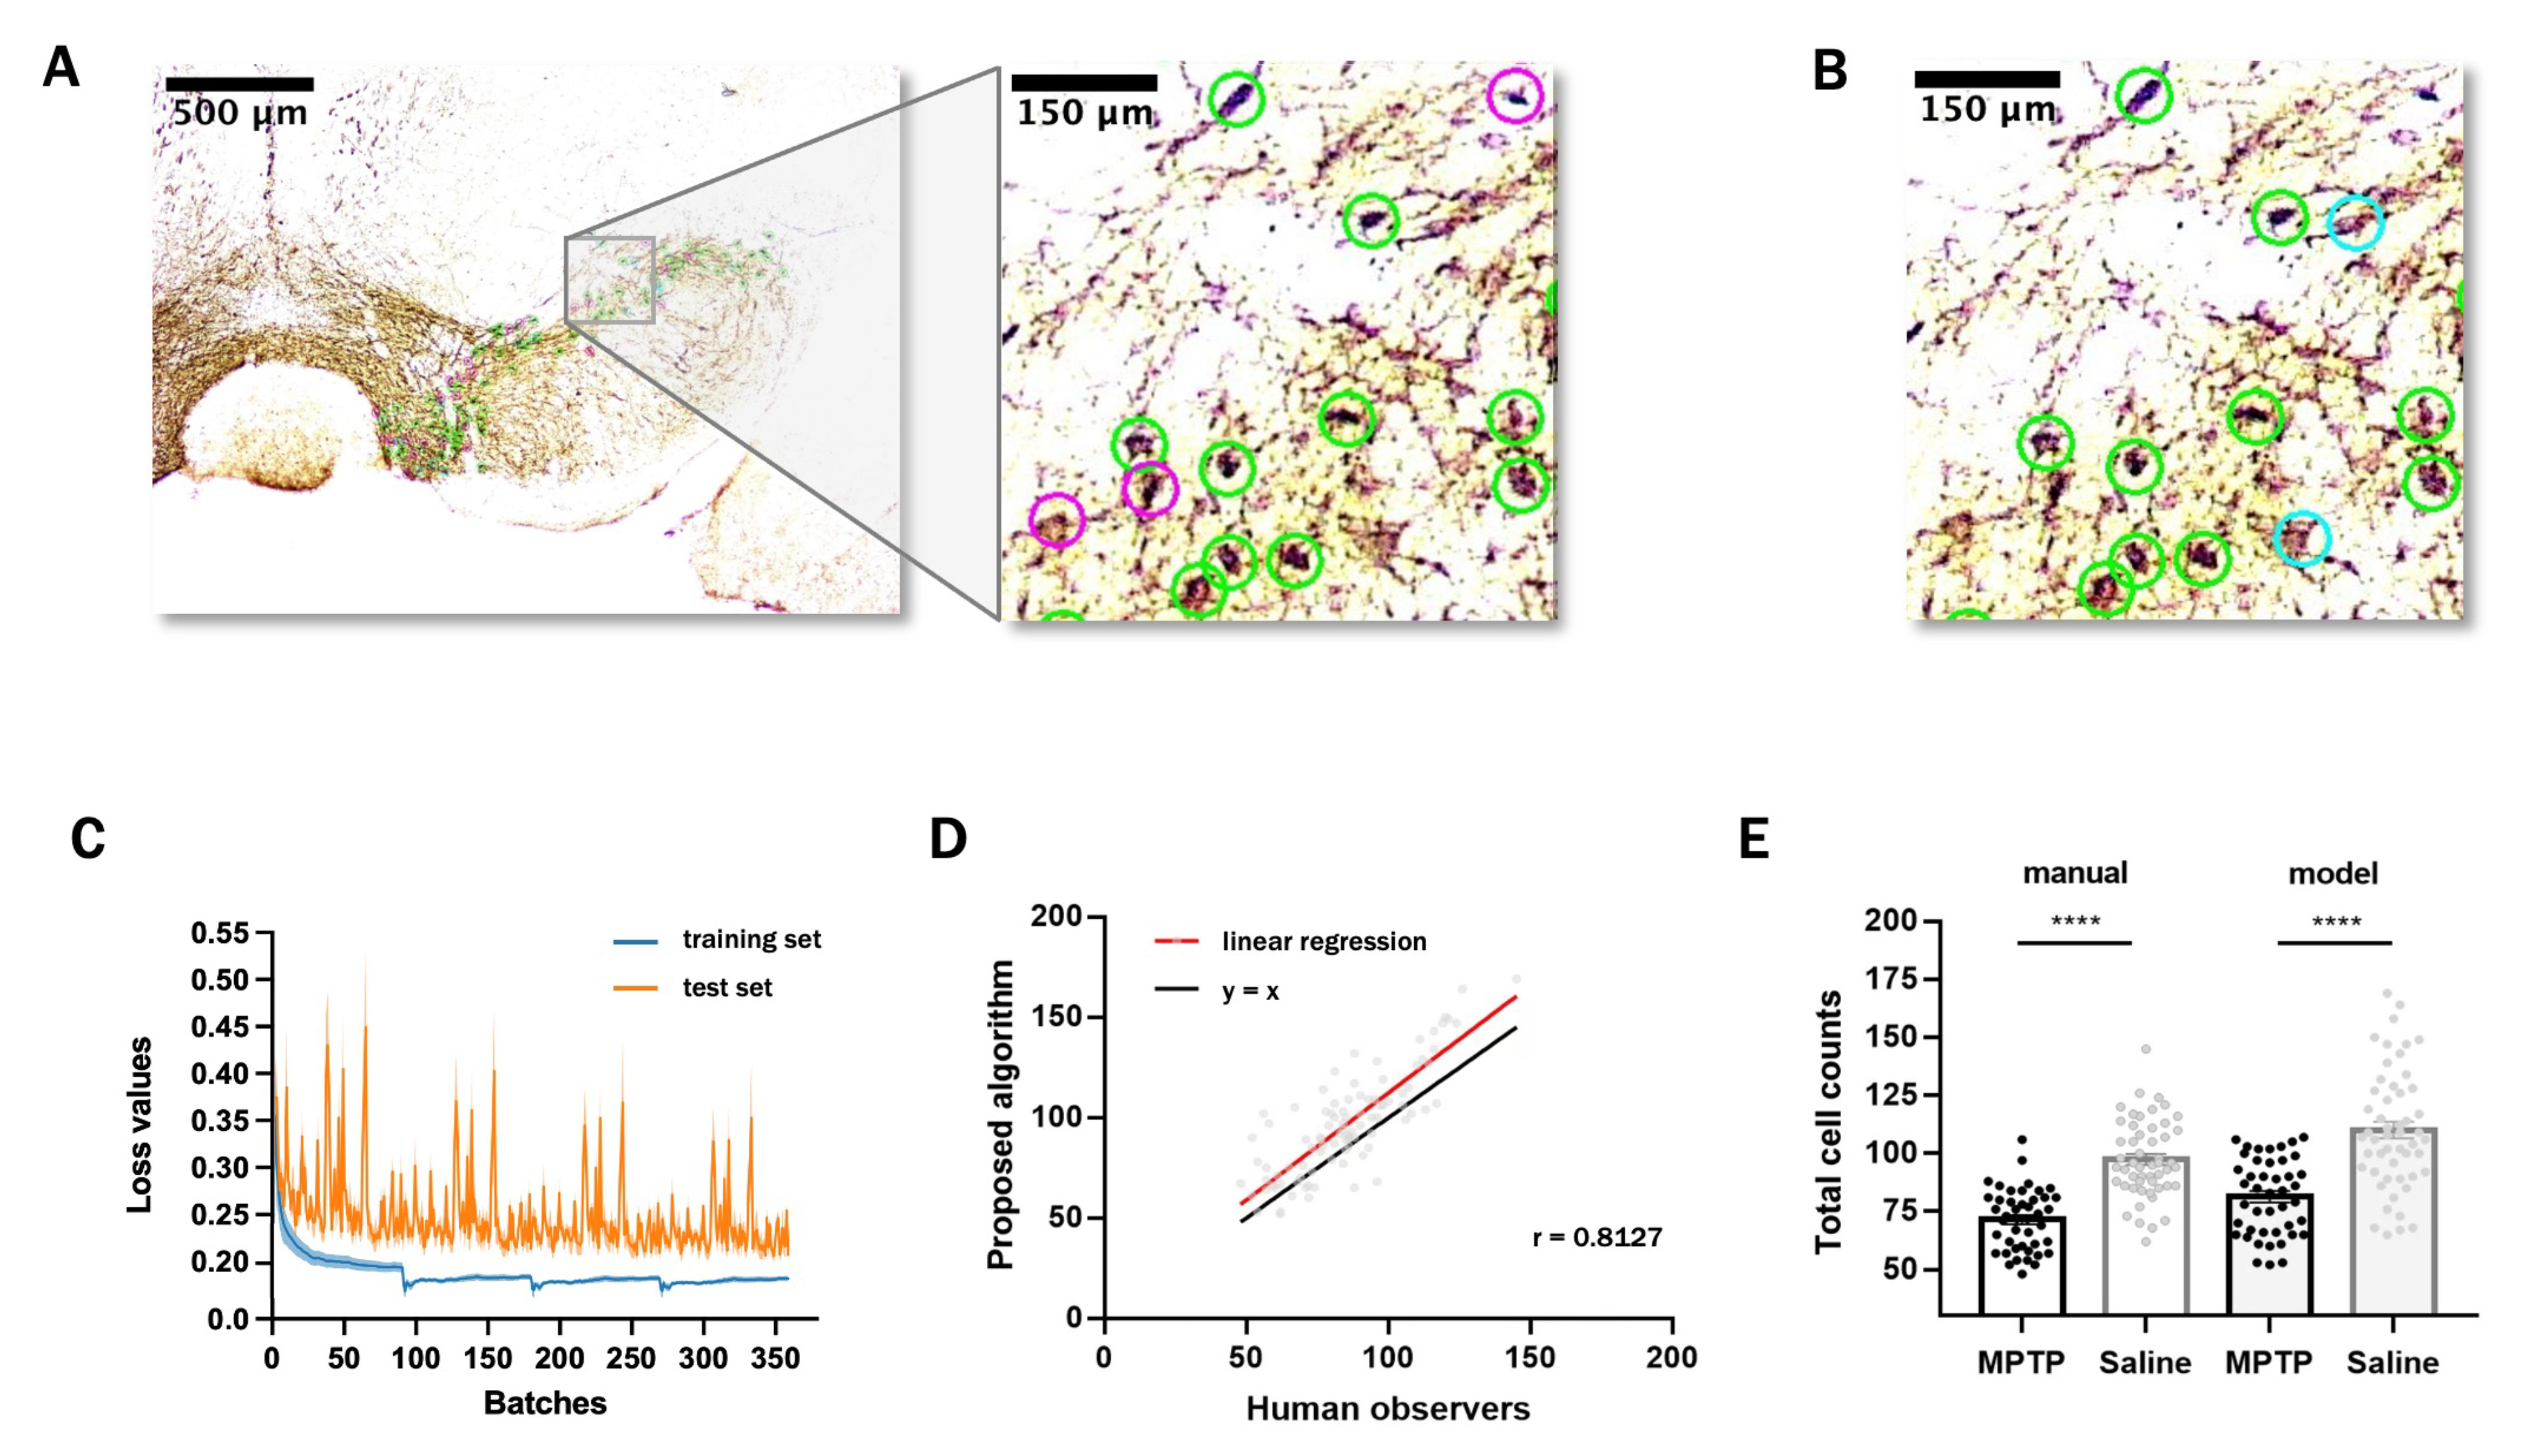
Fig. 5. Detection results obtained by the model and human observers. (A, B) An example of the detection results from the proposed model. Green circles indicate true positives (TP), pink circles indicate false positives (FP), and cyan circles indicate false negatives (FN). (C) The loss value of the training and test set during machine learning training. Since stream processing was used, it is recorded in batches instead of epochs. (D) Correlation between total cell counts of the ground truth and model prediction. The black line is the line of y=x. The red line is the linear regression line (r=0.813; slope=1.07). (E) Model-predicted cell counts in the control (n=52) and MPTP (n=44) groups. Scatter plots indicate cell counts on individual images. Bars indicate mean±SEM. ****p<0.0001 compared to the matched control group (Unpaired t-test).
© Exp Neurobiol