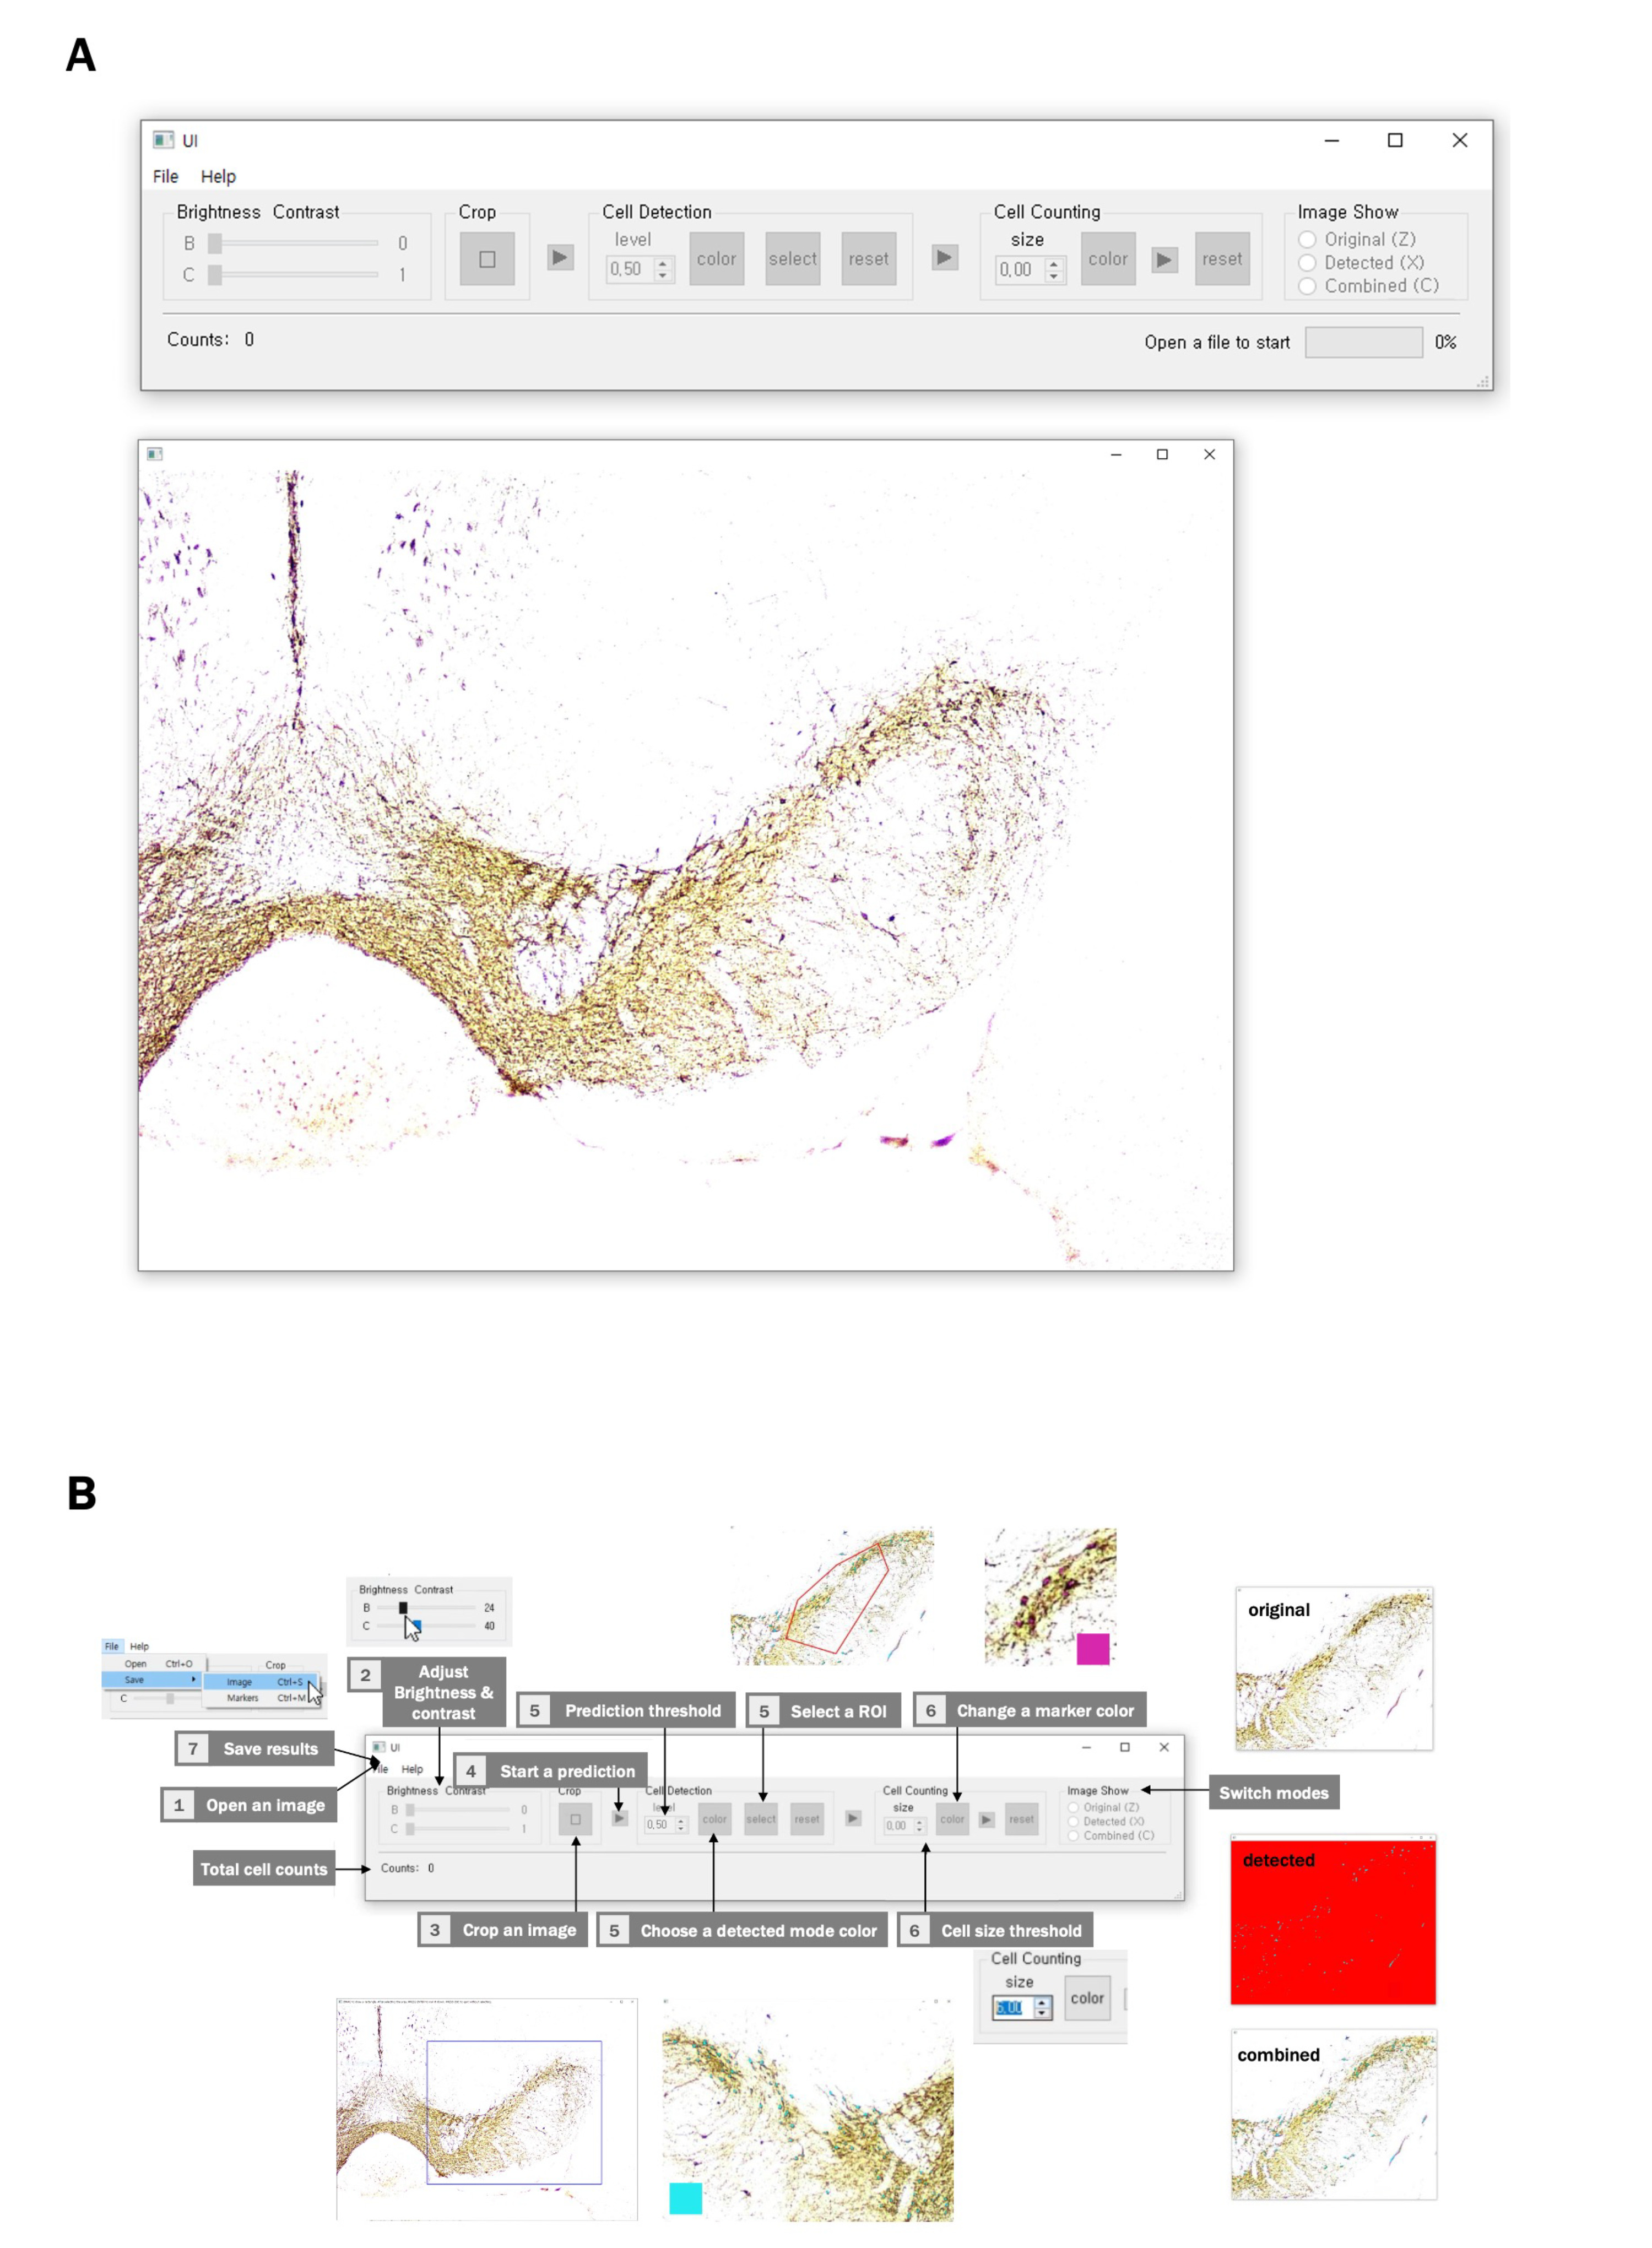
Fig. 7. (A) Graphical use interface (GUI) and its workflow. The GUI comprises a toolbar and an image-showing window. (B) To get started, click the File tab on the Menu bar and open an image file. Once the image is loaded, users can manually adjust its brightness and contrast as required. Then, users can select a rectangular area to discard unnecessary fragments of the image. Once users click the first triangular button, model prediction starts. After a few minutes, a binary image is generated. Users can select the cell threshold, color of the detected area, and region of interest (SNc) with buttons in the “Cell Region Detection” box. By clicking the next triangular button, the centers of the detected areas can be labeled. The result can be modified by clicking the left and right buttons of the mouse to add or delete a marker, respectively. After the prediction, users can change the mode of the image by pushing the keys (“Z,” “X,” and “C”) or clicking the radio buttons in the “Image Show” box anytime. In addition, the reset buttons let users start operations from the original settings of each stage. Total cell count is shown at the bottom of the interface. The image-showing window can be moved using the keys “A,” “D,” “W,” and “S.” The size of the image can be modified using the “up-arrow” and “down-arrow” keys.
© Exp Neurobiol