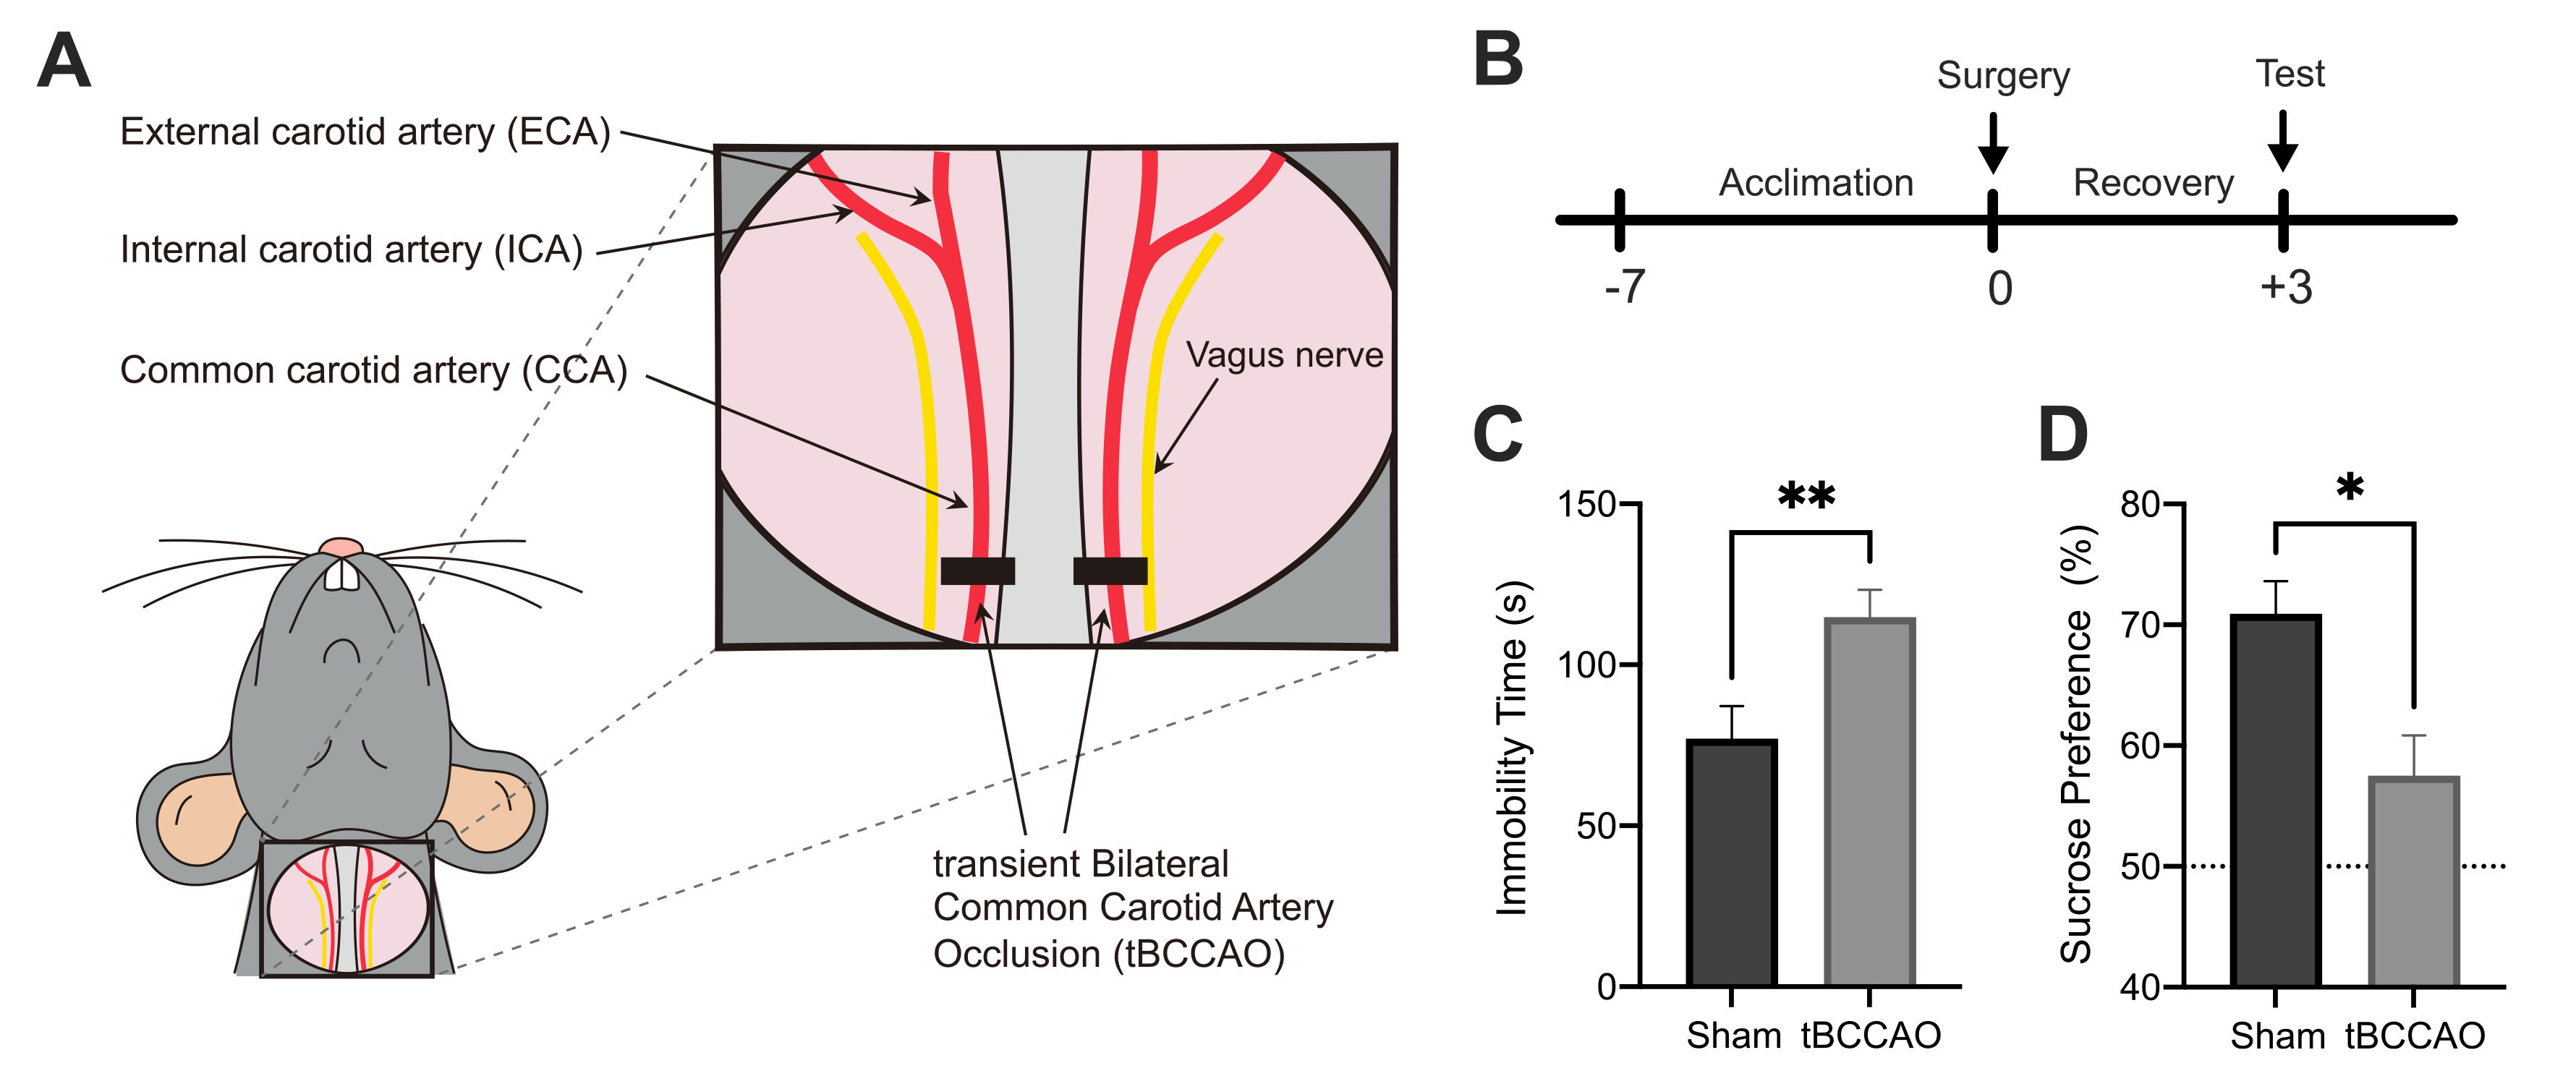
Fig. 1. Depressive-like behavior after tBCCAO. (A) Schematic flow of surgery and behavioral test. (B) Immobility time during forced swimming test (FST). The tBCCAO group showed a significantly longer immobility time than the sham control group (sham=19, tBCCAO=27, p=0.007). (C) Sucrose preference between tBCCAO and sham control group. (D) The tBCCAO group showed significantly lower sucrose preference than the sham control (sham=9, tBCCAO=16, p=0.012). *p<0.05, **p<0.01.
© Exp Neurobiol