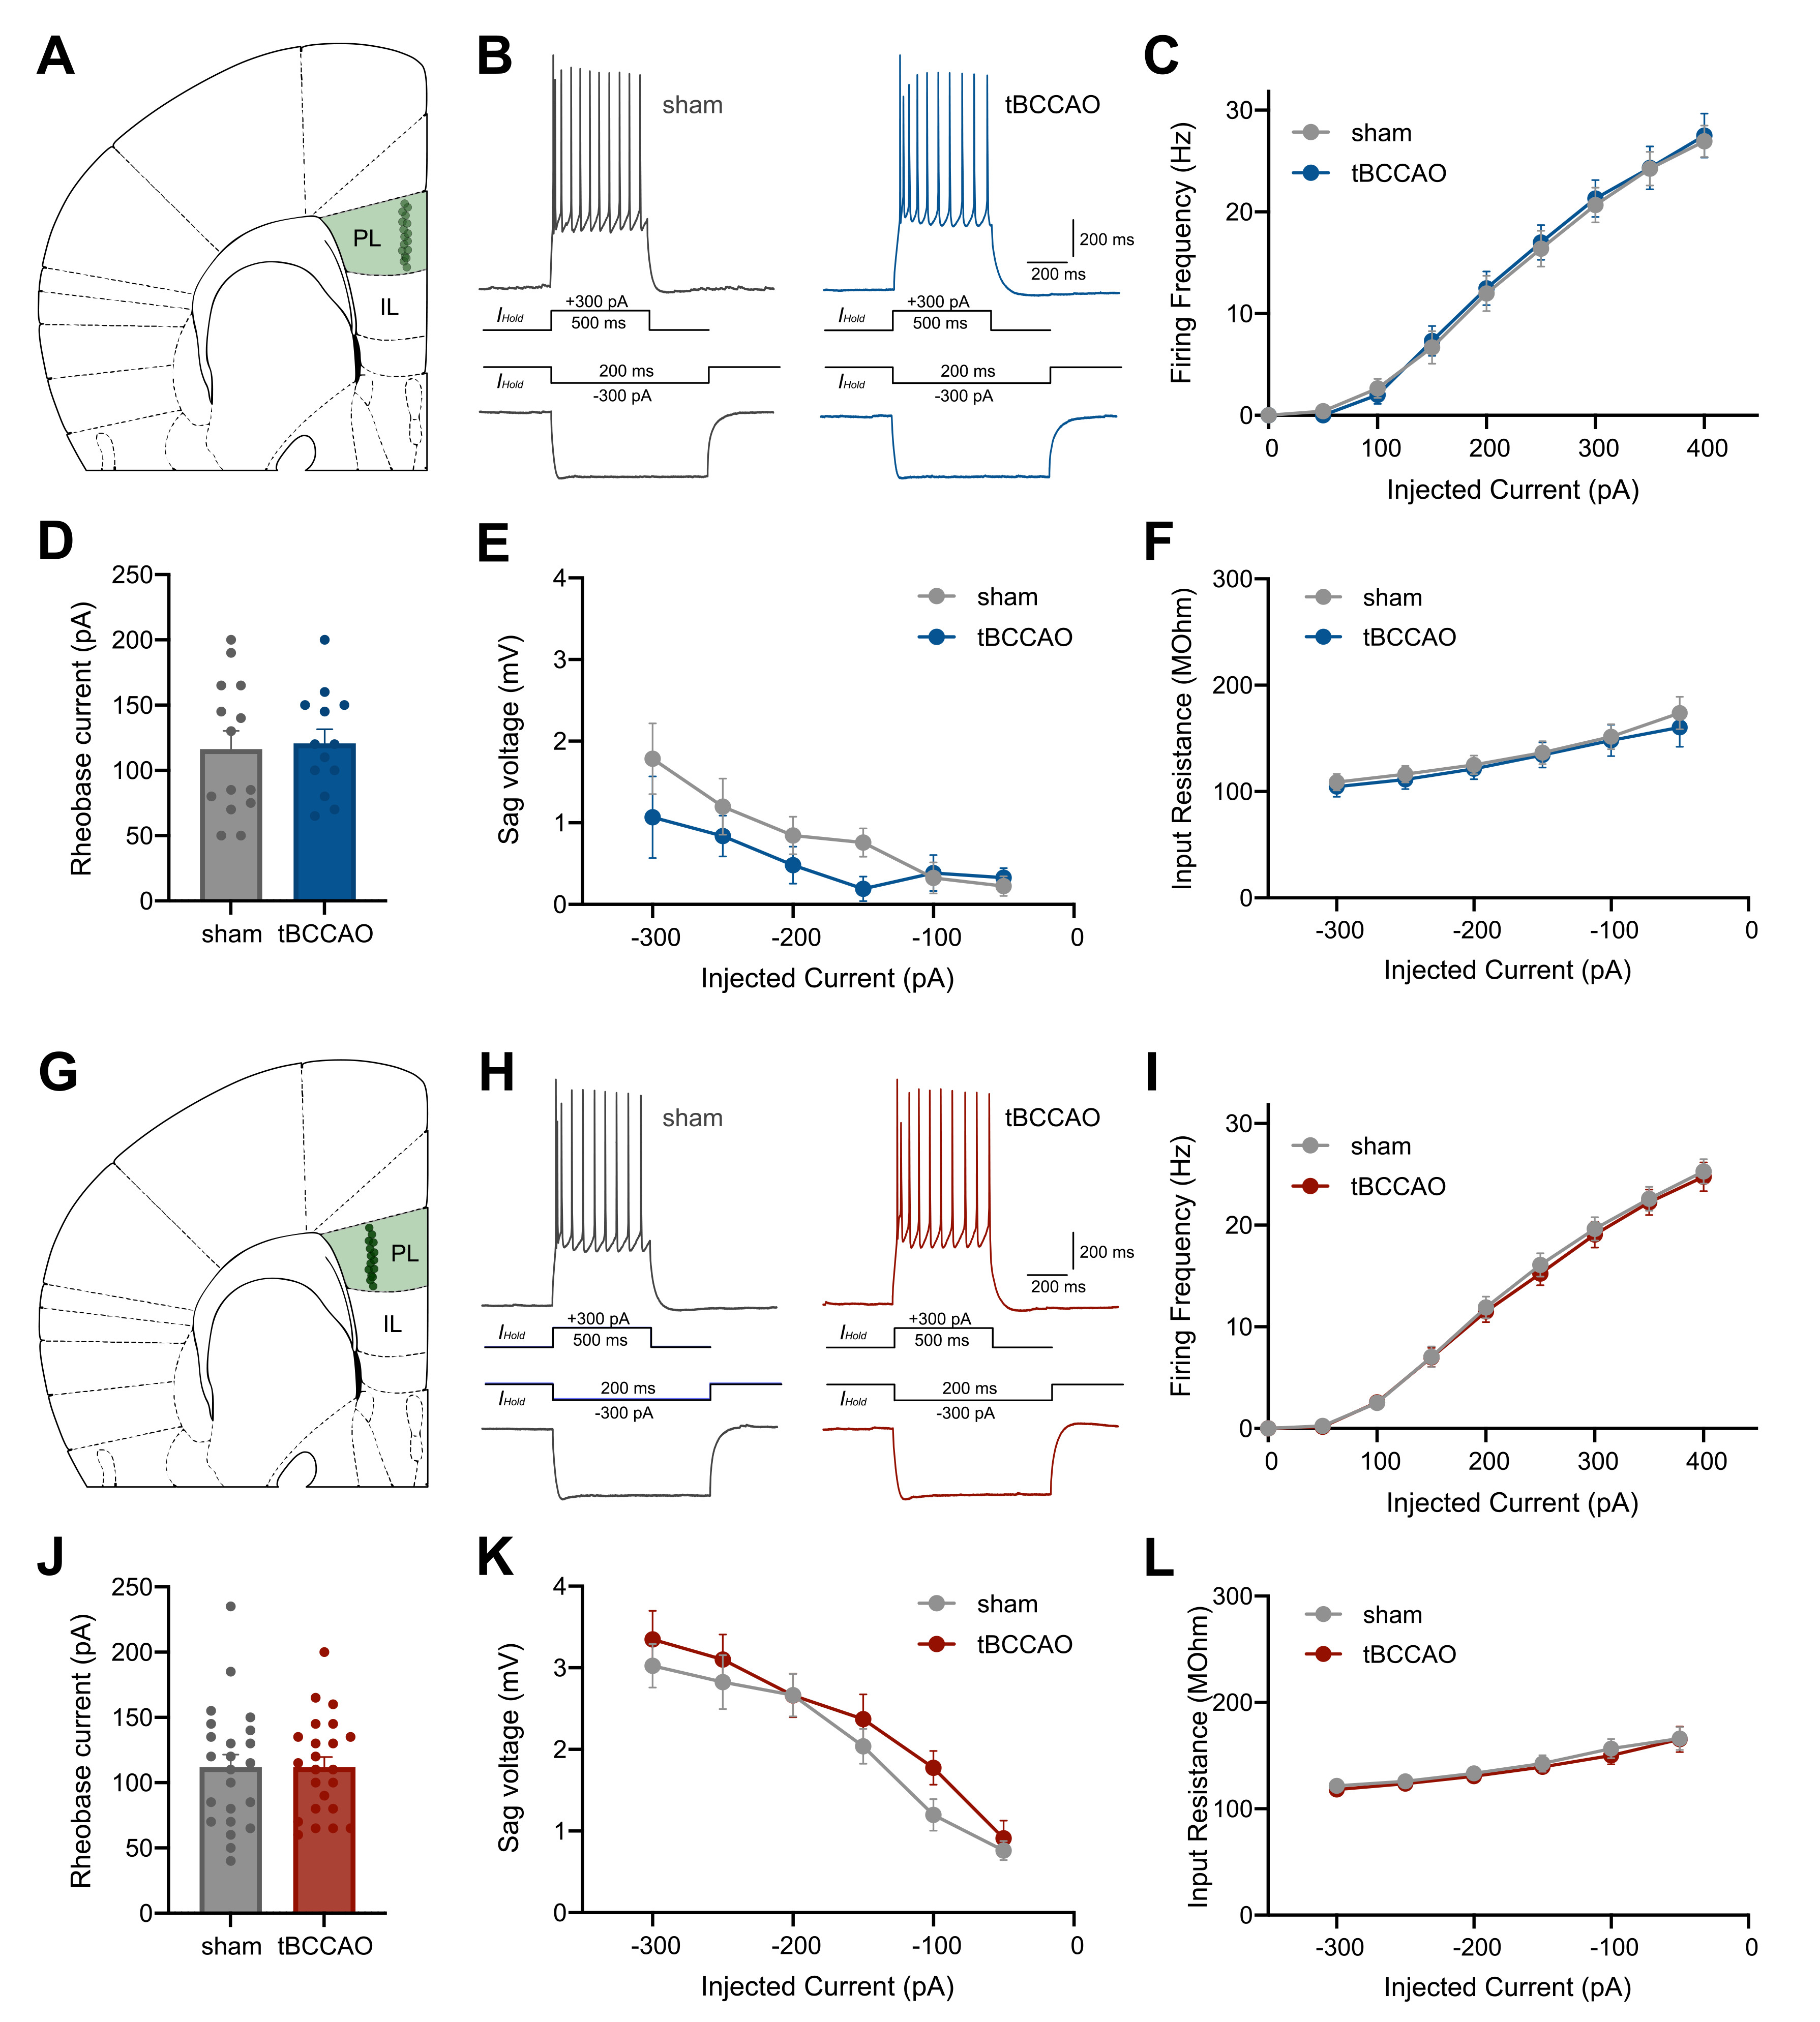
Fig. 2. Prelimbic pyramidal neurons in both layer 2/3 and layer 5 were not altered after tBCCAO. (A) Schematic figure of layer 2/3 neurons in the PL. (B) Representative traces from depolarizing and hyperpolarizing current injection protocol. In PL layer 2/3 neurons, (C) firing frequency and (D) rheobase current of tBCCAO group was comparable to those of sham group (sham=14, tBCCAO=13; firing frequency, p=0.998; rheobase current, p=0.809). (E) The Sag voltage and (F) input resistance of tBCCAO group were comparable to those of sham group (sham=13, tBCCAO=10; sag voltage, p=0.388; input resistance, p=0.789). (G) Schematic figure of layer 5 neurons in the PL. (H) Representative traces from depolarizing and hyperpolarizing current injection protocol. In PL layer 5 neurons, (I) firing frequency and (J) rheobase current of tBCCAO group were comparable to those of sham group (sham=23, tBCCAO=23; firing frequency, p=0.998; rheobase current, p=0.999). (K) Sag voltage and (L) input resistance of tBCCAO group were comparable to those of sham group (sham=23, tBCCAO=23; sag voltage, p=0.708; input resistance, p=0.959).
© Exp Neurobiol