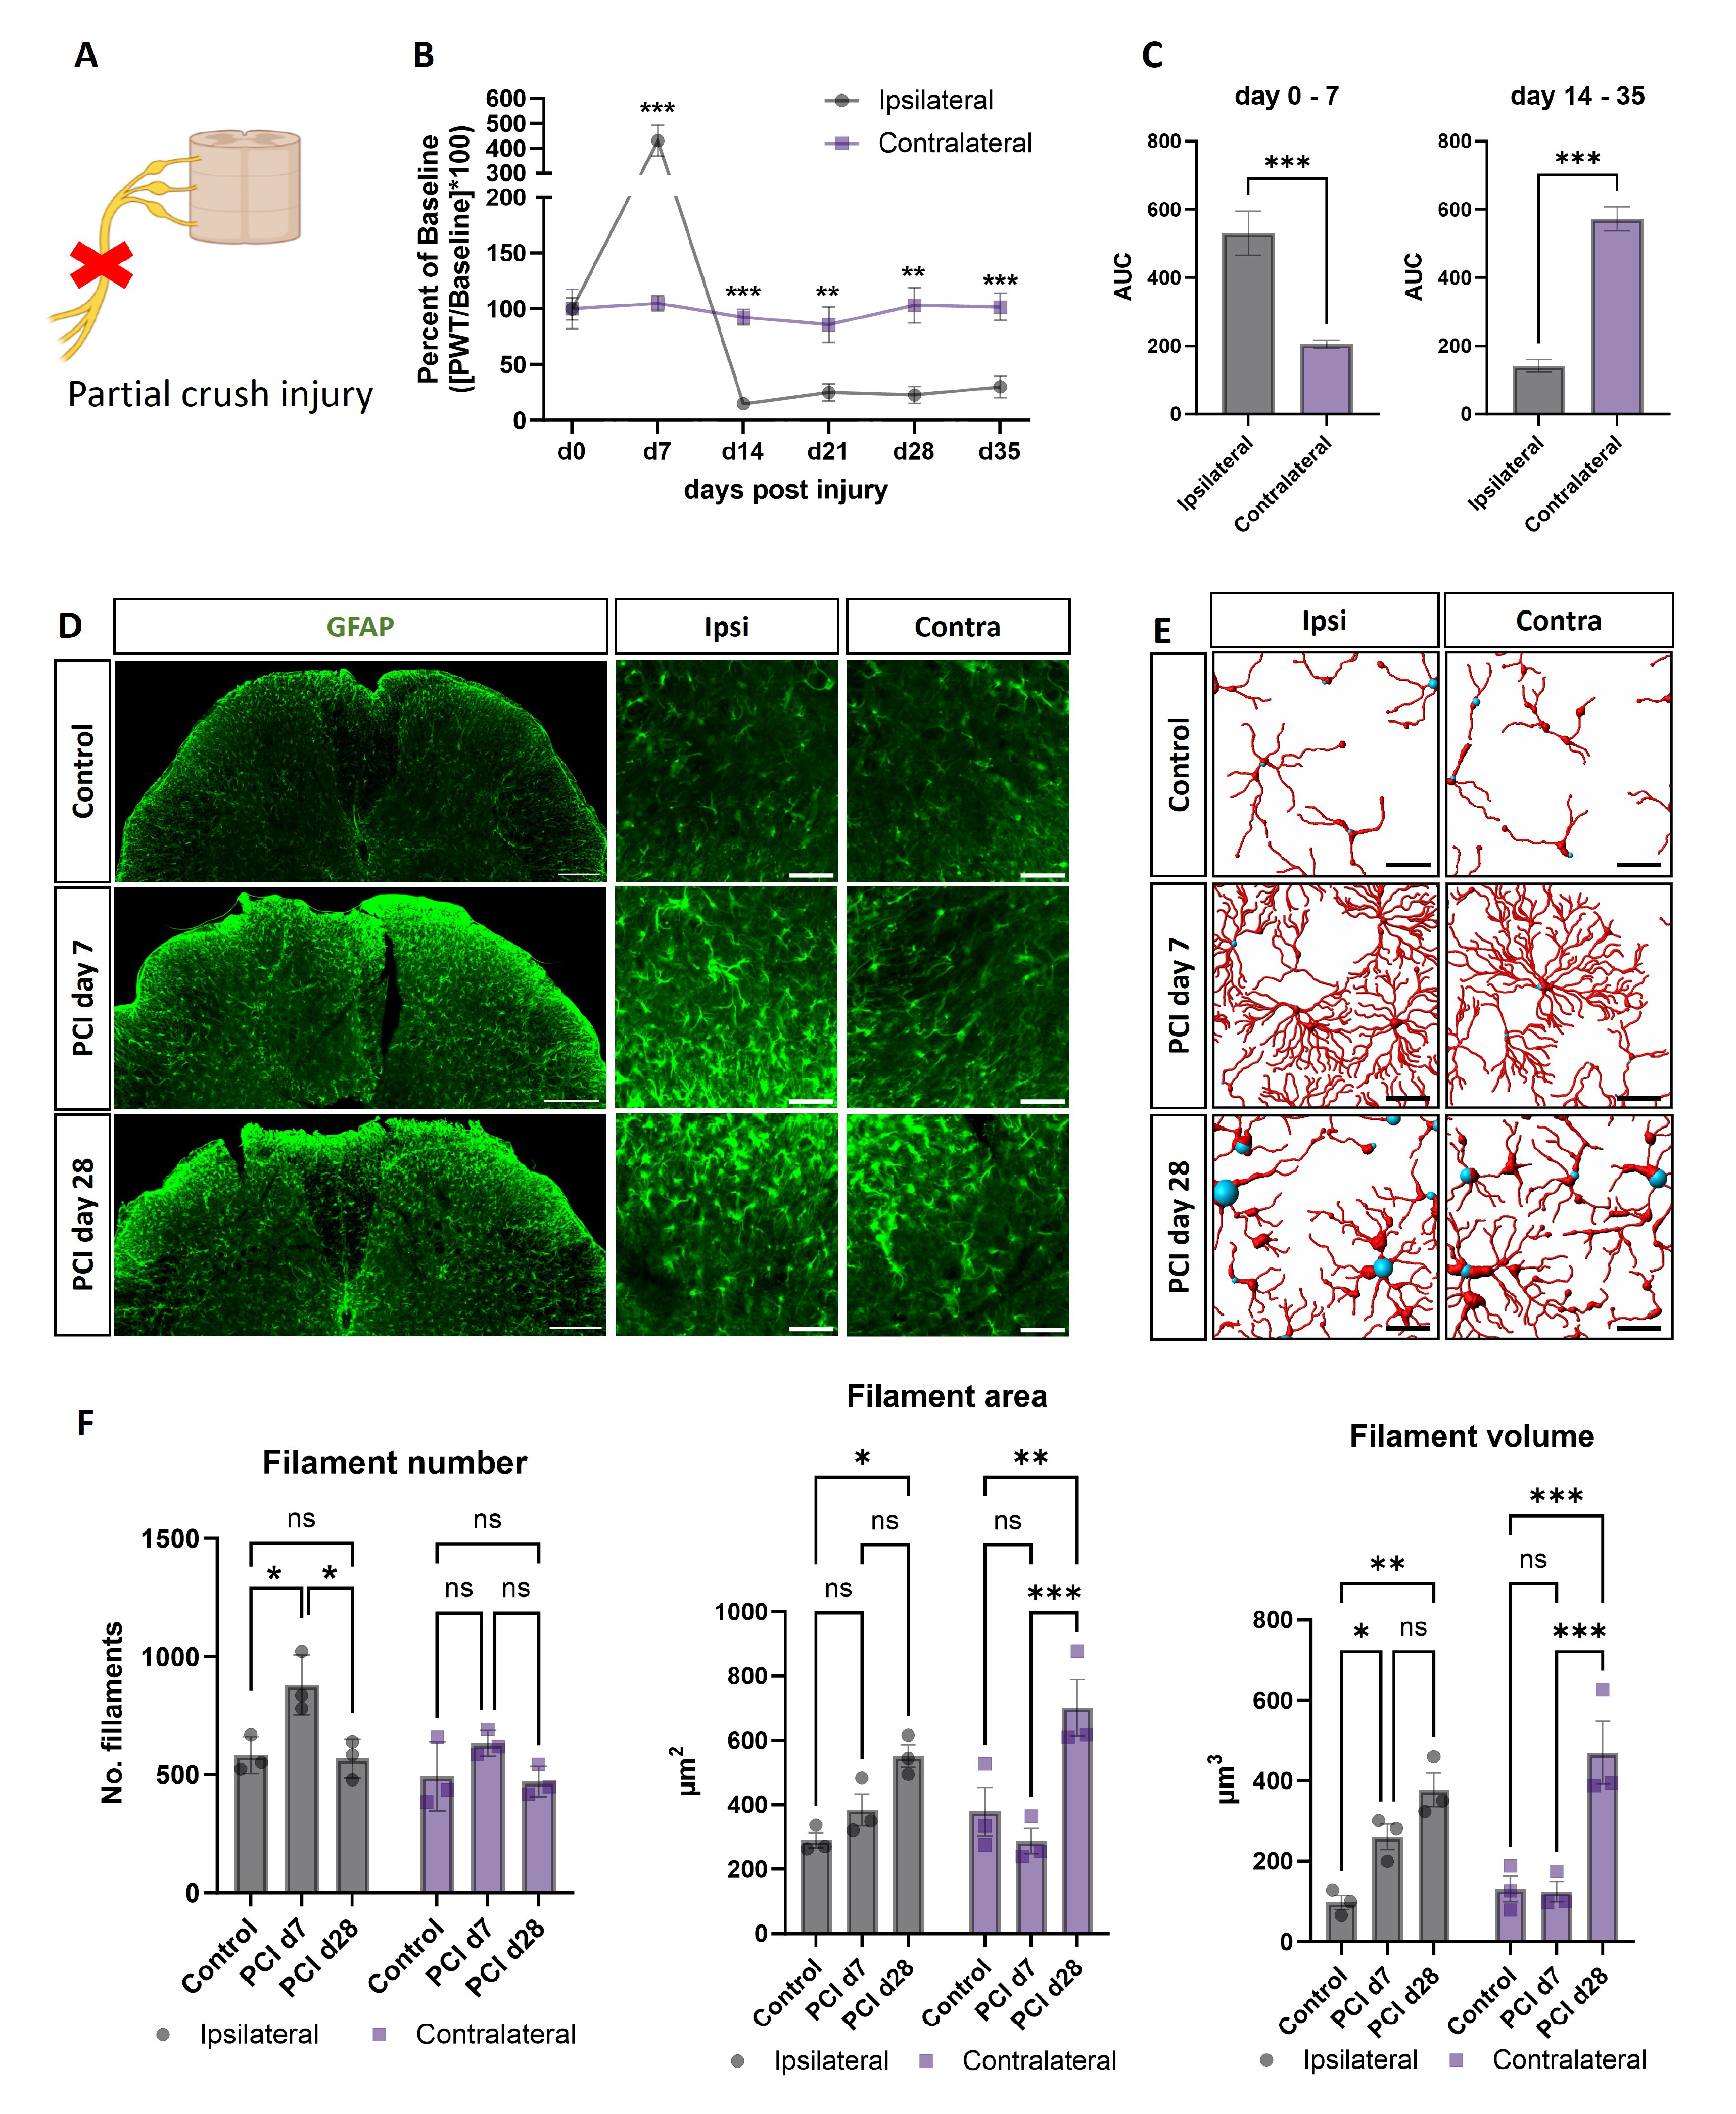
Fig. 1. Characterization of spinal astrocytes in partial crush injury model. (A) Partial crush injury model. (B) Percentage of withdrawal threshold in PCI model. (C) Area under curve between ipsilateral and contralateral from day 0 to day 7 and from day 14 to day 35. Unpaired two-tailed-t-test: **p=0.001, ***p<0.001. (D) Representative images for the GFAP expression (Green: GFAP). Scale bar: 200 µm (left), 50 µm (right). (E) Representative astrocyte structure using IMARIS. Scale bar: 20 µm. (F) Analysis of astrocytic dendrite structure, represented in filament number, area and volume. Two-way ANOVA with Tukey’s multiple comparison test (*p<0.01, **p<0.005, ***p<0.001, ns: non-significant, p>0.05).
© Exp Neurobiol