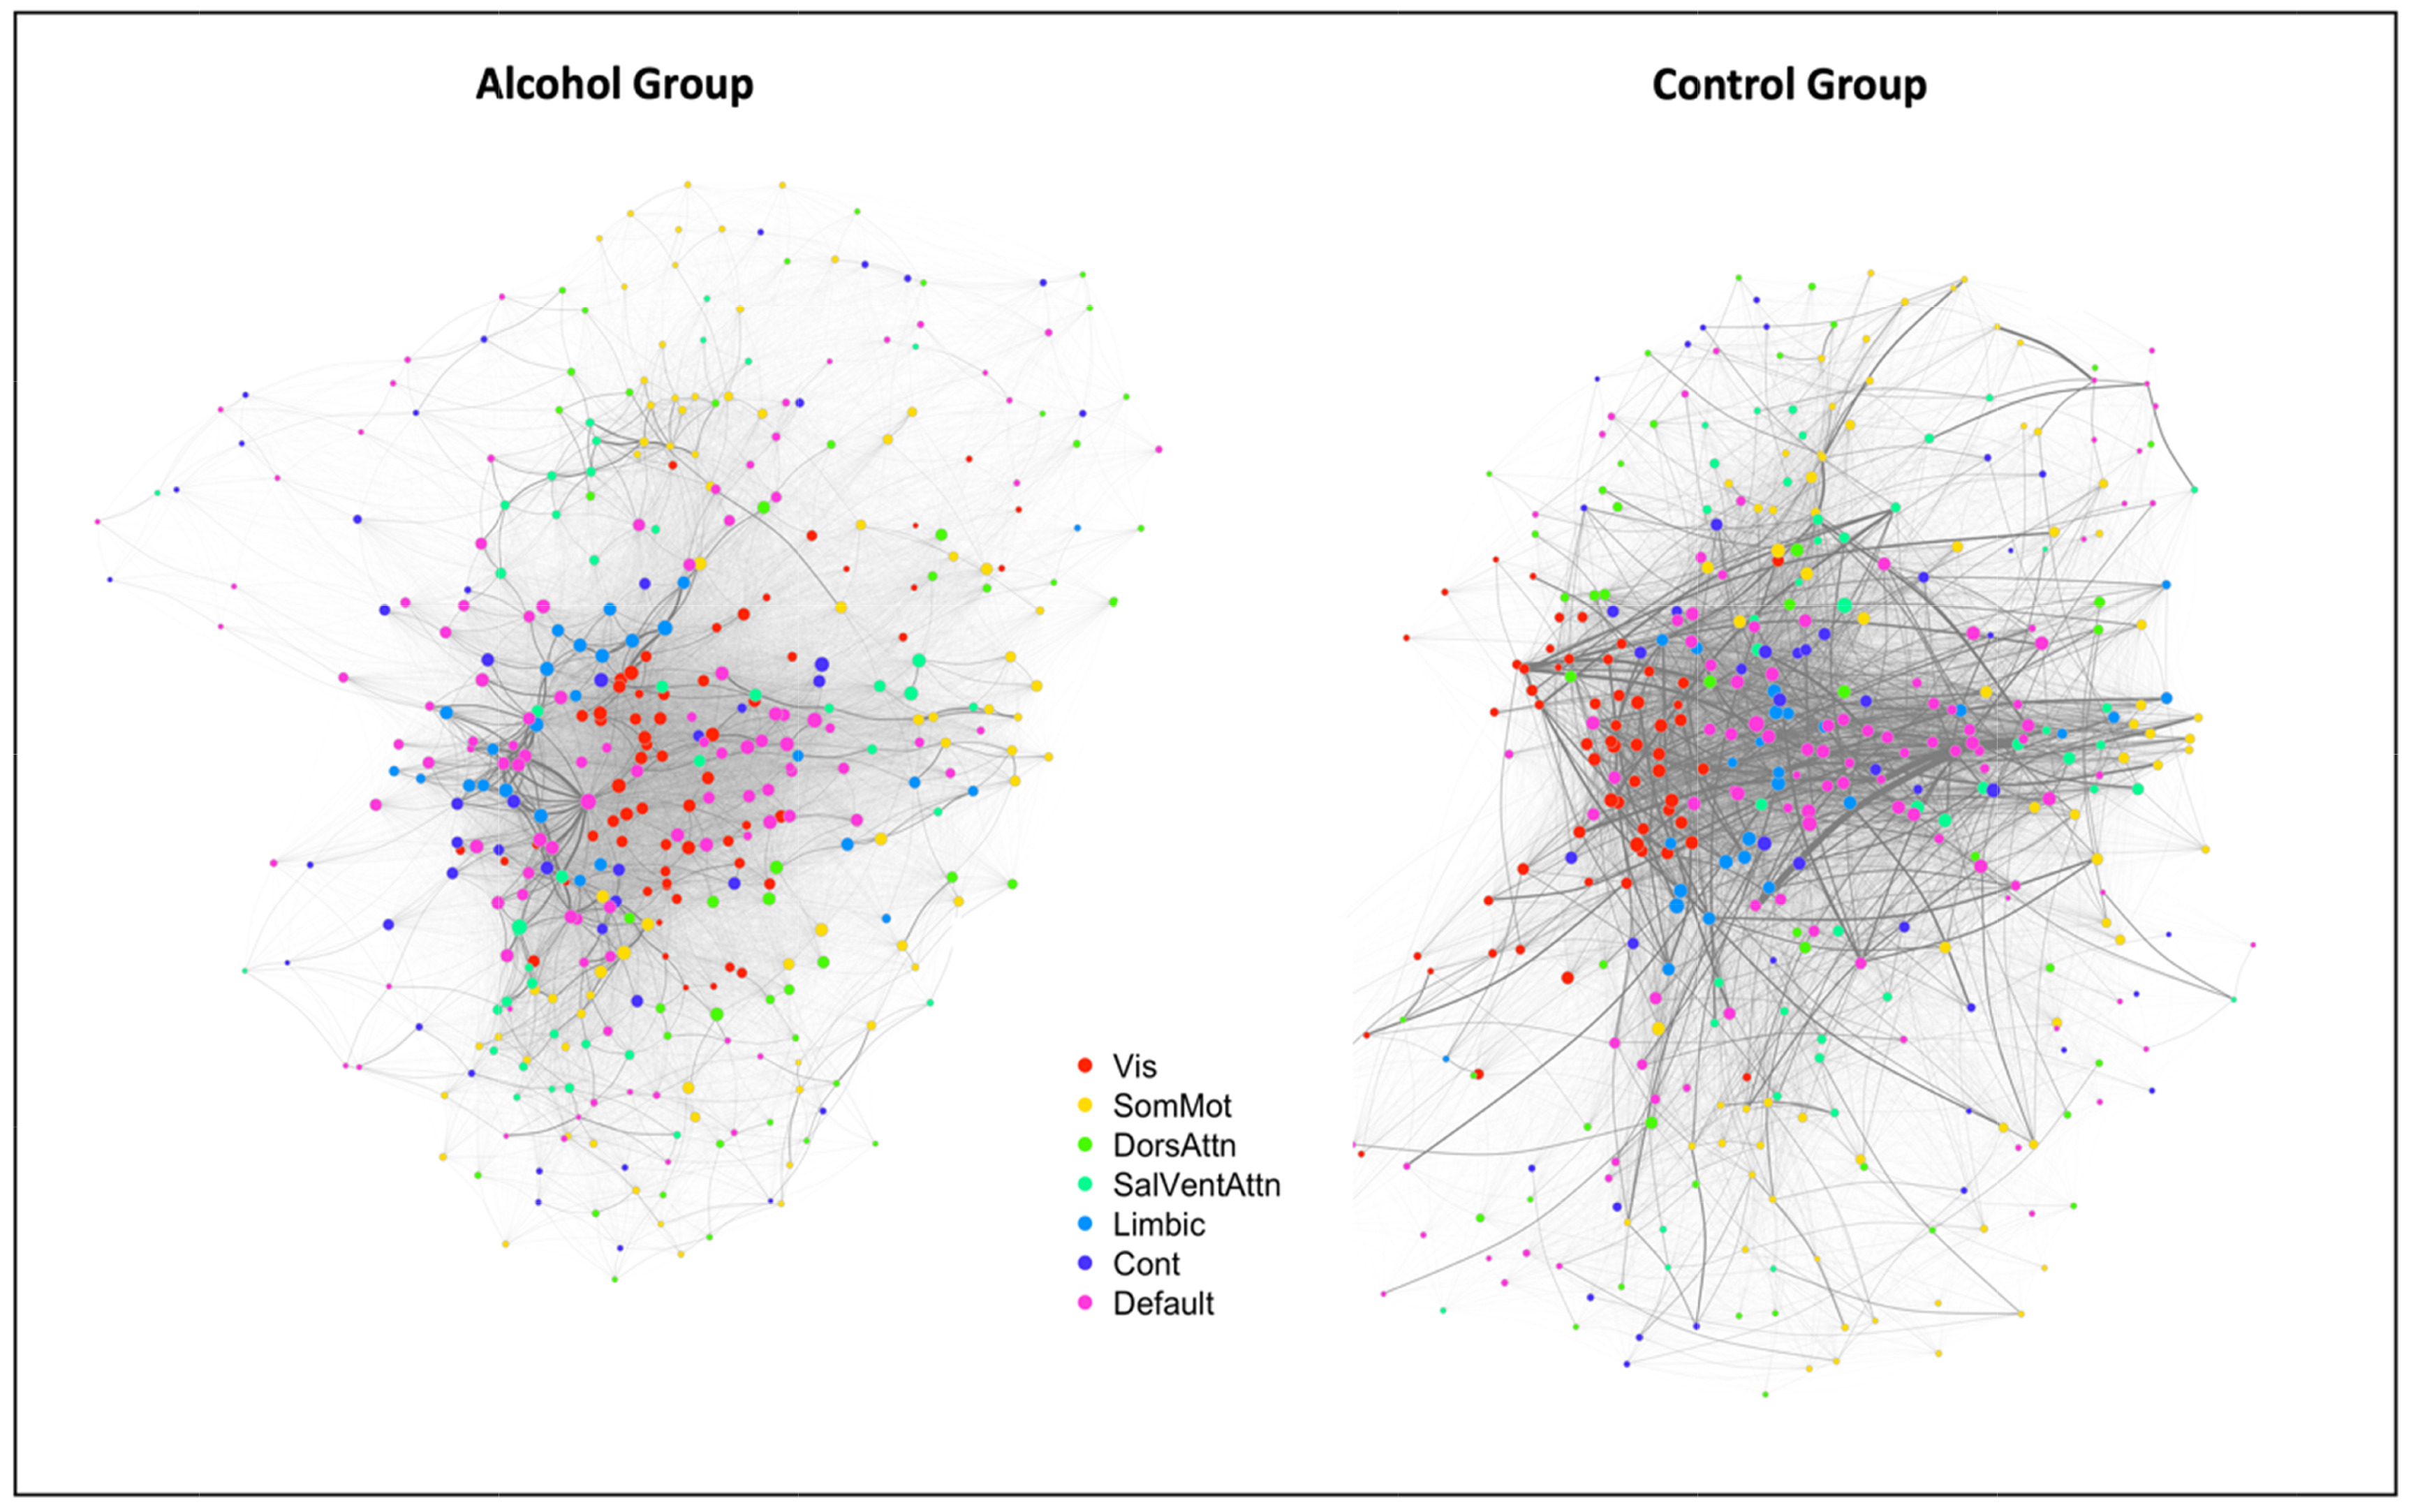
Fig. 2. Visualiation of the whole-brain network. The whole-brain network generated from averaged adjacency matrix of each group. Radius of nodes was set to rescaled node degree. Transparency and width of the edge were set to rescaled fiber counts. Nodes of the alcohol group are sparsely distributed and less densely connected compared with the control group. Vis, visual network; SomMot, somato-motor network; DorsAttn, dorsal attention network; SalVentAttn, salience ventral attention network; Limbic, limbic network; Cont, control network; Default, default mode network.
© Exp Neurobiol