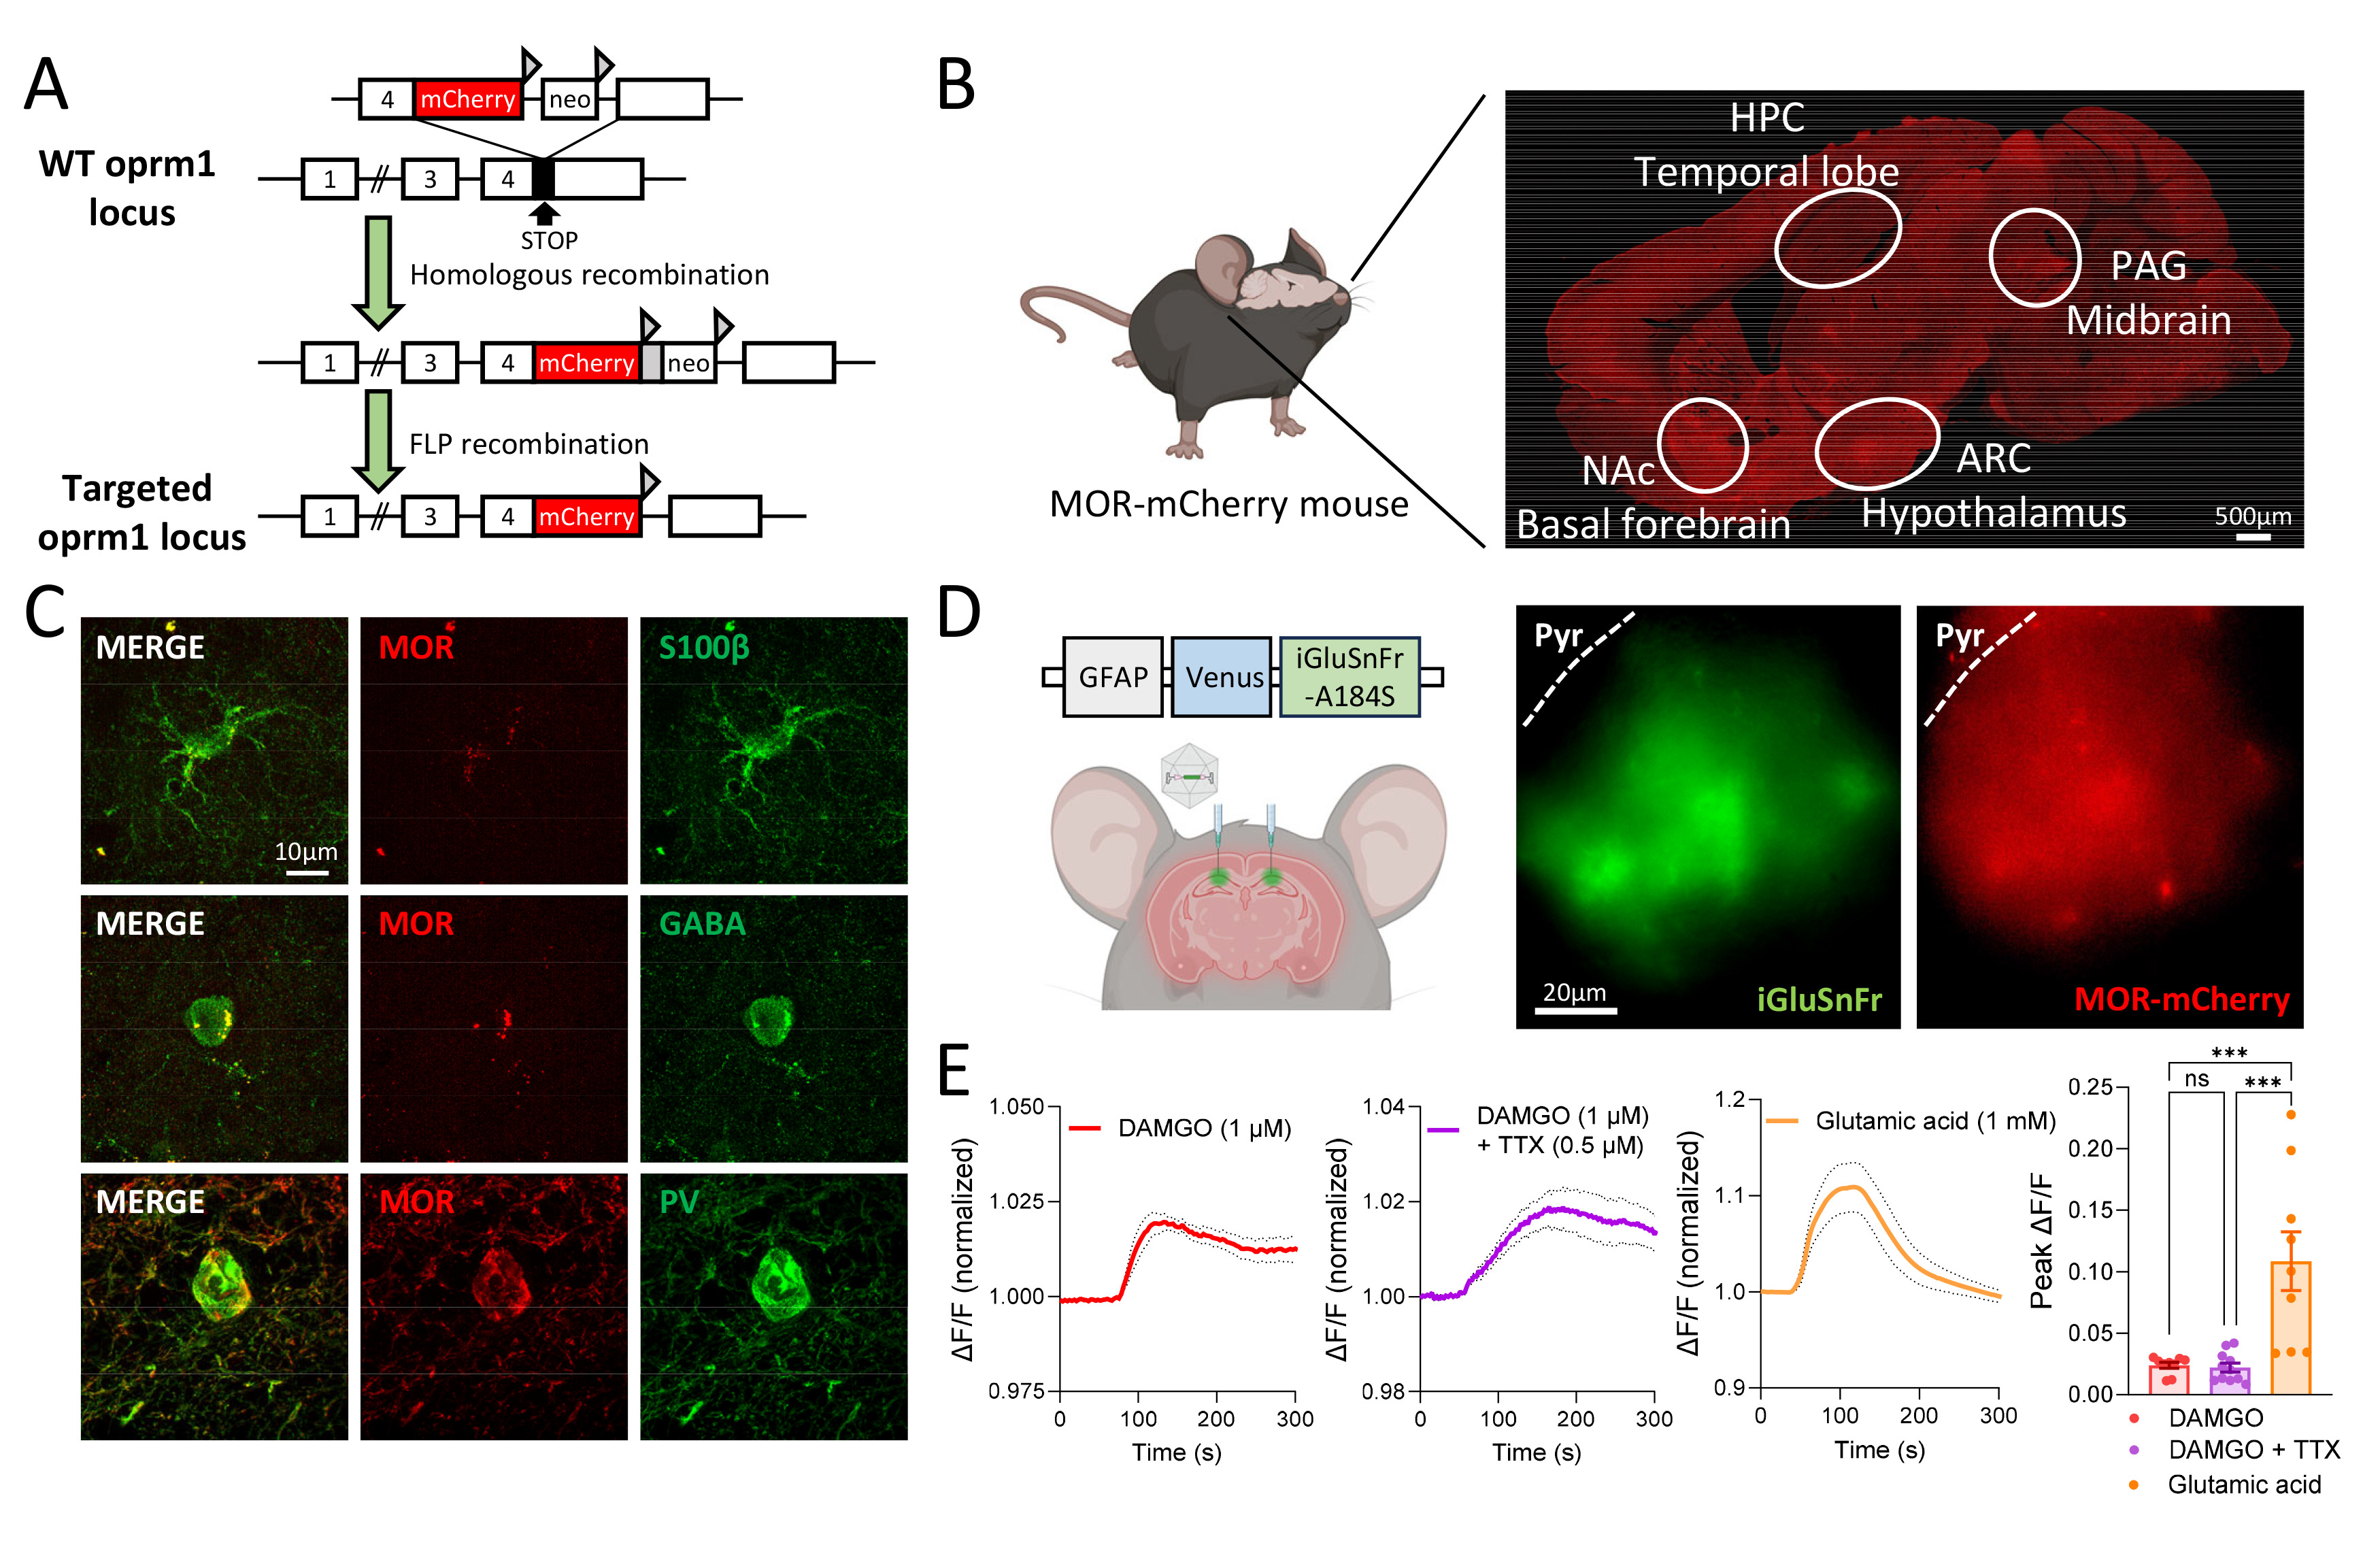
Fig. 1. Expression of functional MOR in the hippocampus of MOR-mCherry mice. (A) Schematic images of the construction of the MOR-mCherry reporter gene. (B) Expression pattern of MOR-associated mCherry in the various brain regions. (C) Representative SIM images of MOR-mCherry expressed in astrocytes, GABAergic neurons, and PV neurons of the hippocampus. (D) Representative images of iGluSnFr (glutamate sensor) and MOR-mCherry expression in the hippocampus of MOR-mCherry mice. (E) Summary traces of glutamate signal from iGluSnFr expressing astrocytes with an application of DAMGO (1 μM), TTX (0.5 μM), and glutamic acid (1 mM). Data are presented as the mean±s.e.m. ***p<0.001.
© Exp Neurobiol