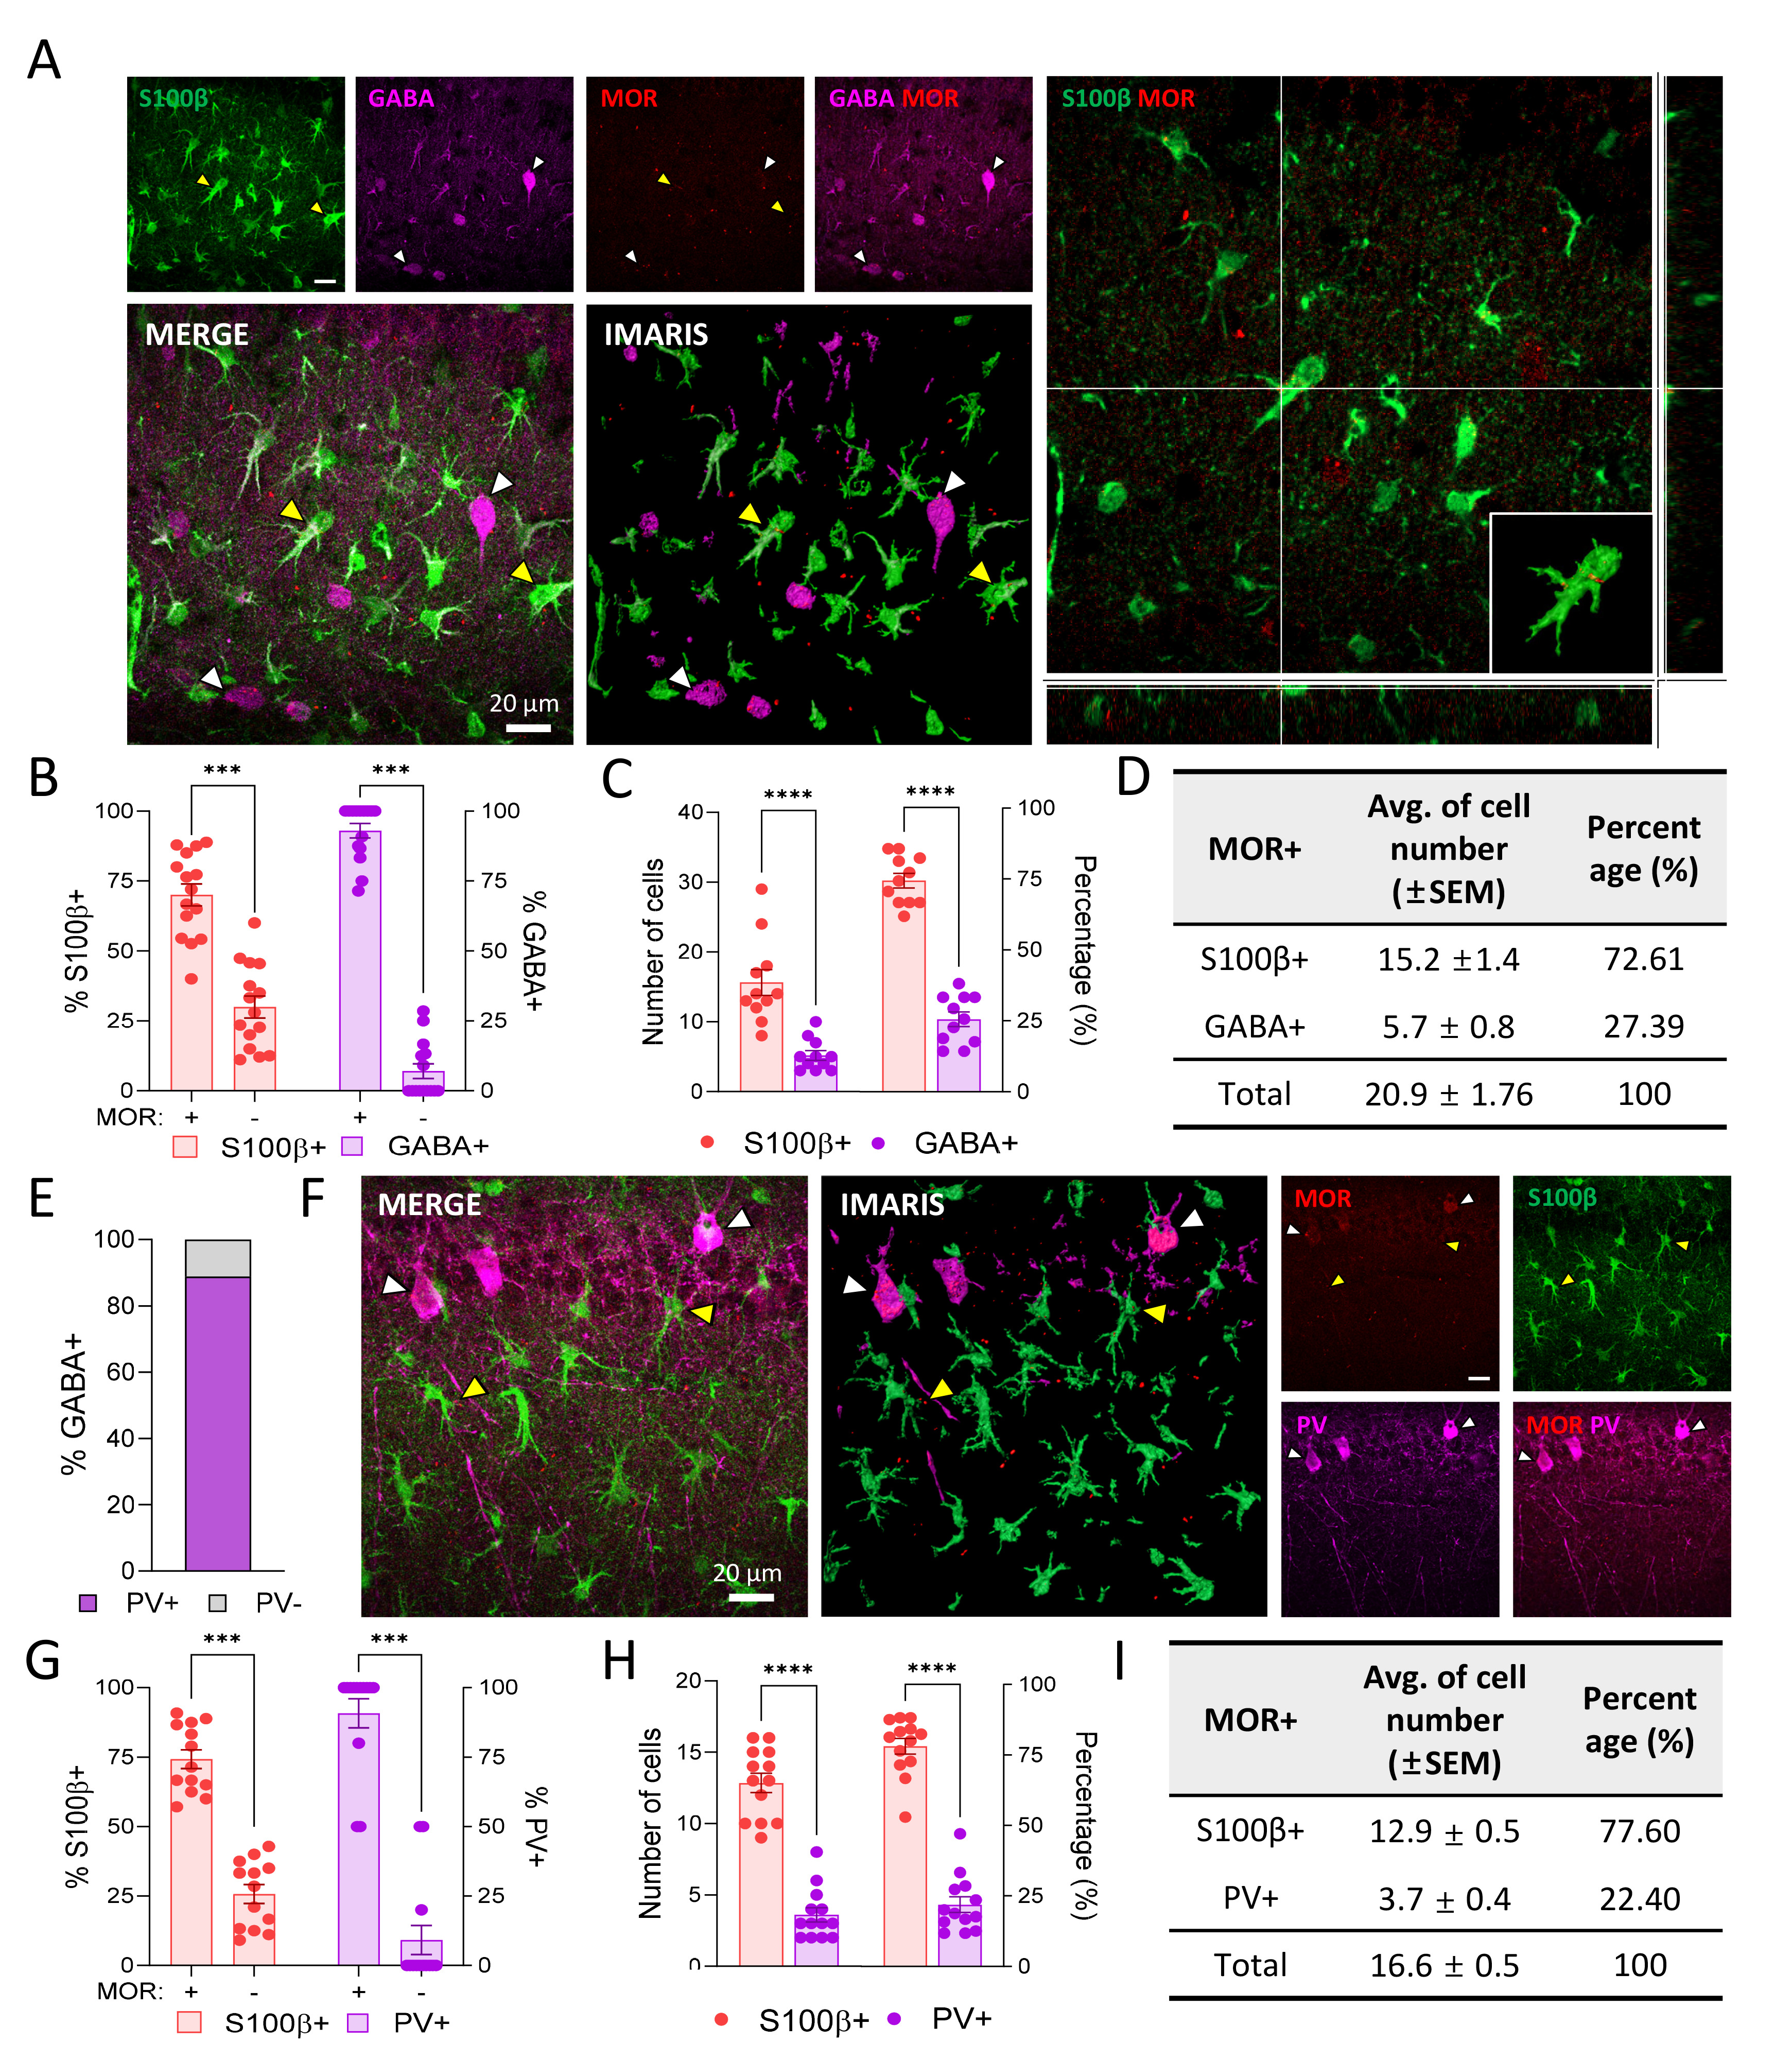
Fig. 2. MOR expression in the hippocampus. (A) Expression of MOR-mCherry, S100β, and GABA in the hippocampus of MOR-mCherry mice (yellow arrowheads indicate astrocytes; white arrowheads indicate GABAergic neurons). 3D rendering image was constructed with Imaris software. (B~D) Bar graph of S100β and GABA (B), number of cells and percentage of MOR positive cells (C), and summary table (D) in the hippocampus. (E) Bar graph of the percentage of PV positive cells in GABAergic neurons. (F) Expression of MOR-mCherry, S100β, and PV in the hippocampus of MOR-mCherry mice (yellow arrowheads indicate astrocytes; white arrowheads indicate PV neurons). 3D rendering image was constructed with Imaris software. (G~I) Bar graph of MOR population in S100β and PV (G), number of cells and percentage of MOR positive cells (H), and summary table (I) in the hippocampus. Data are presented as the mean±s.e.m. ***p<0.001, ****p<0.0001.
© Exp Neurobiol