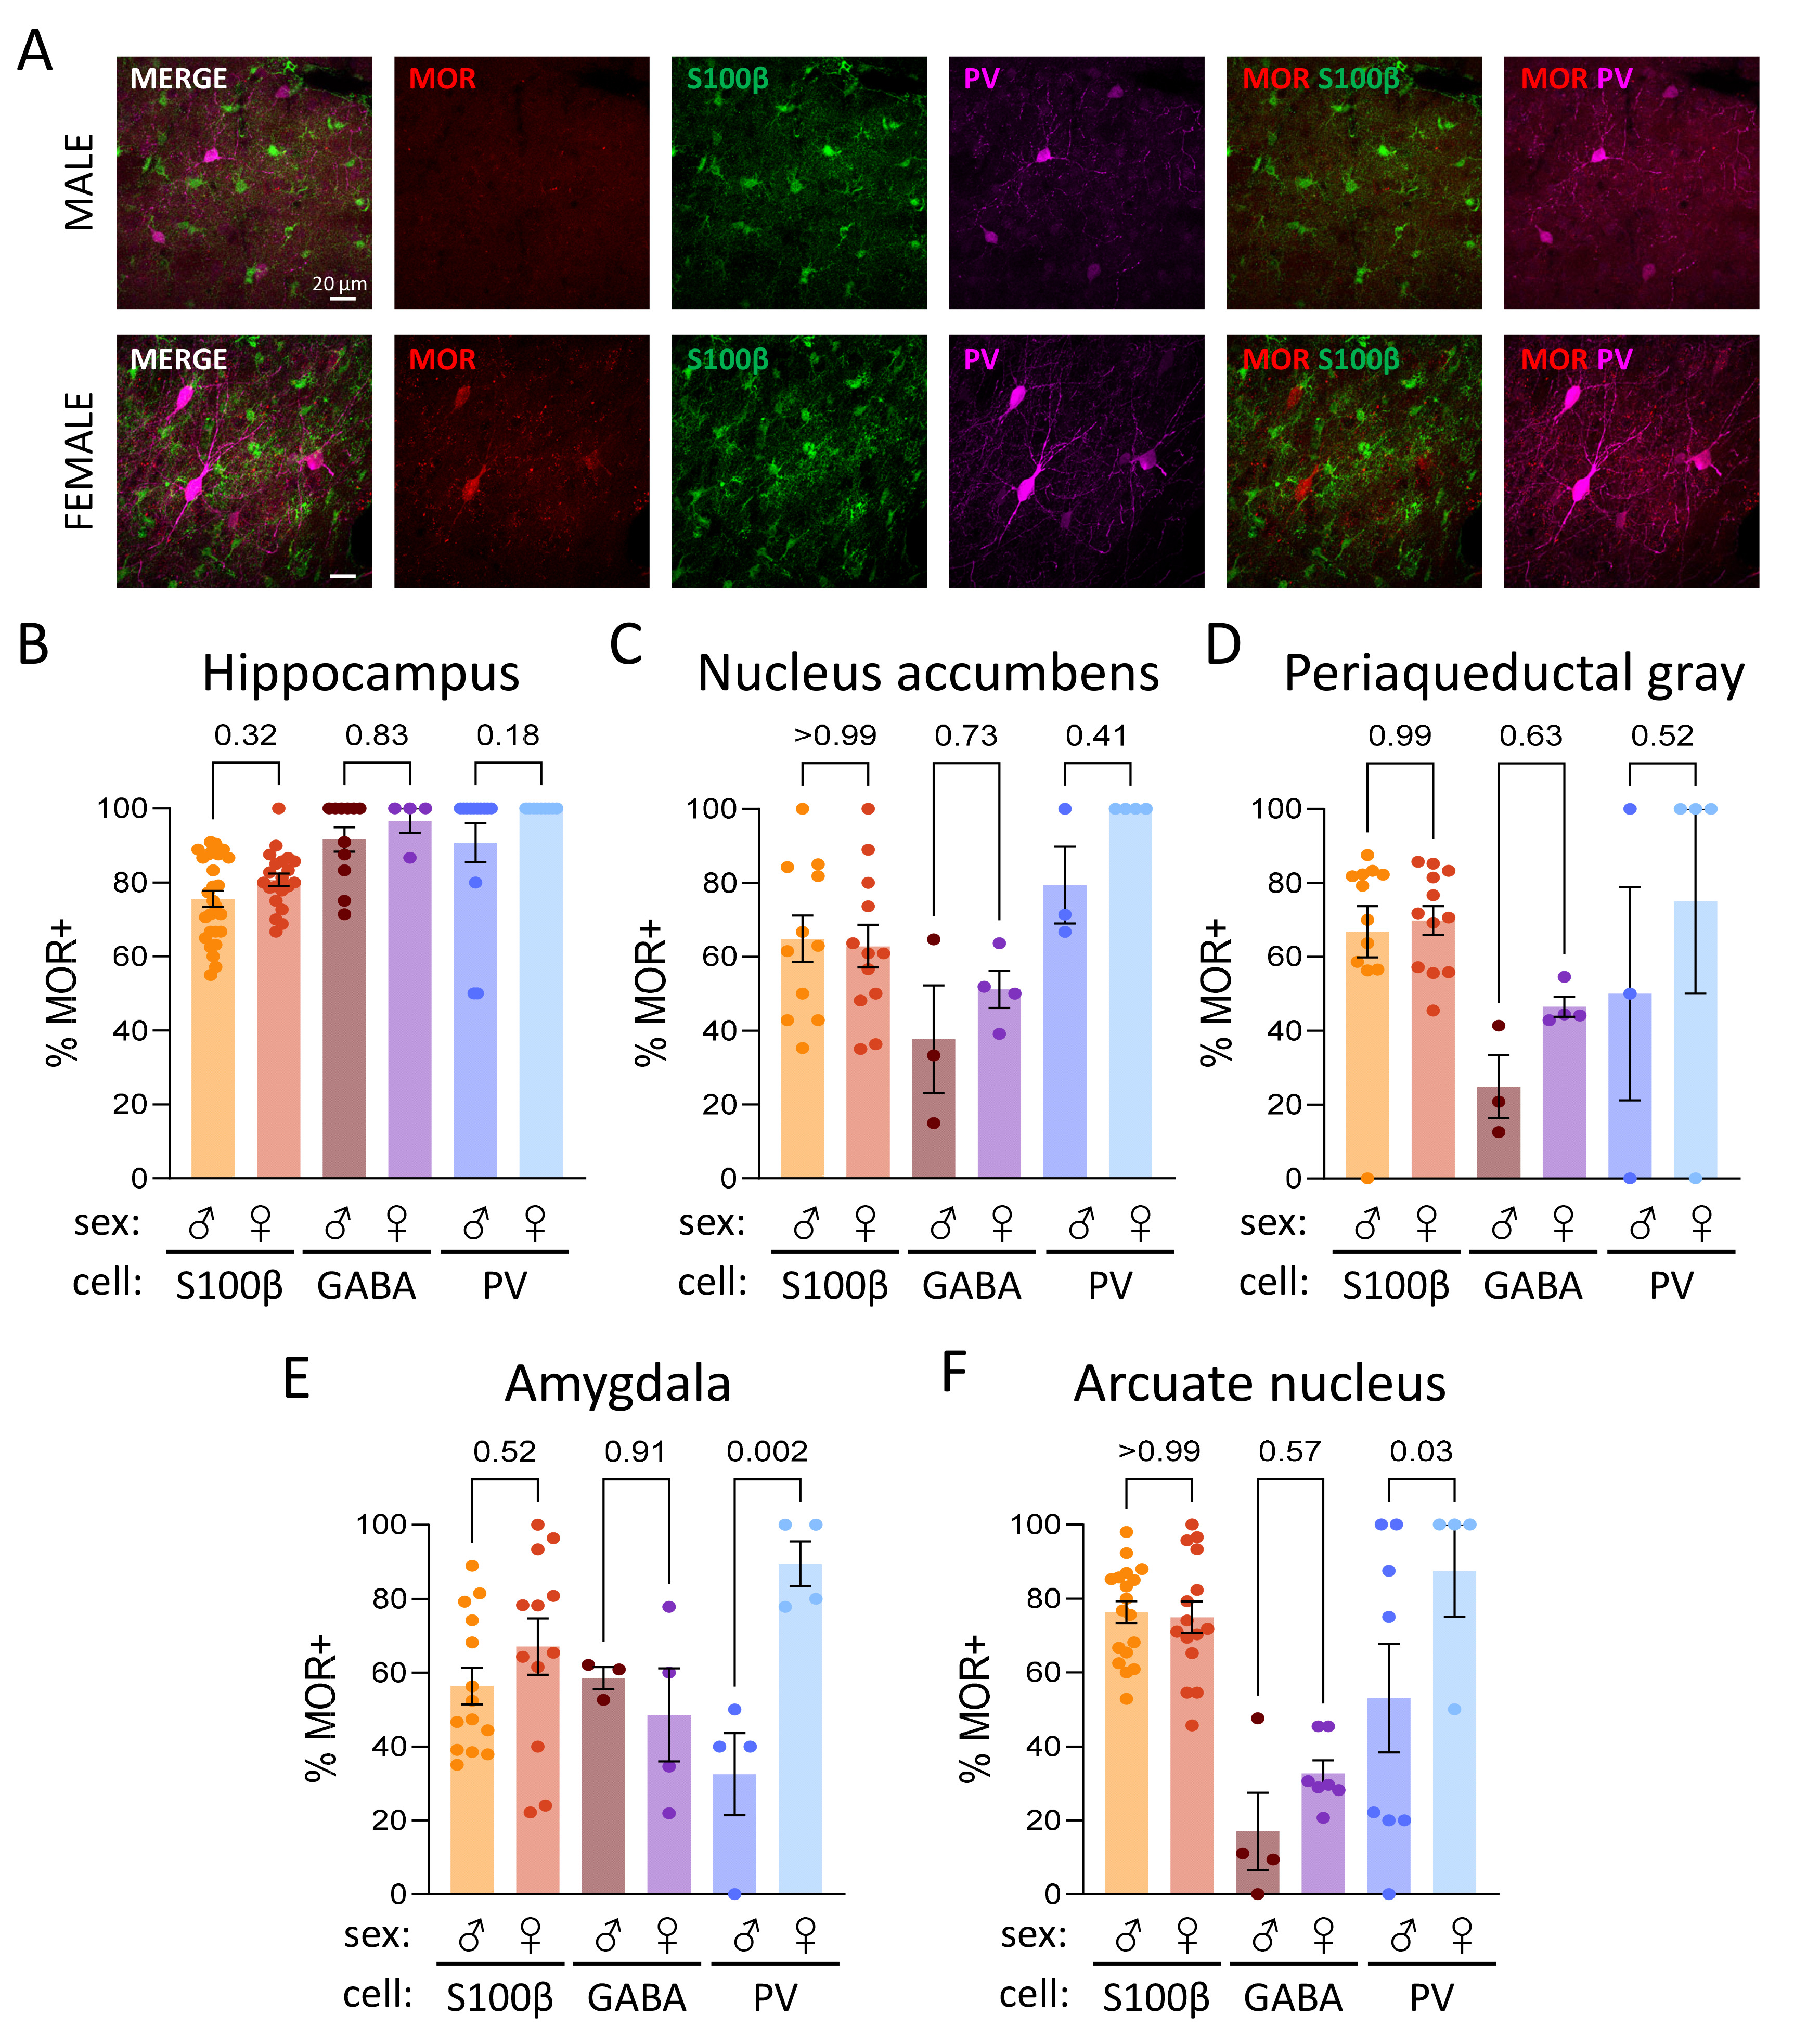
Fig. 7. Sex-dependent expression of MOR-mCherry. (A) Representative images of sex-dependent MOR expression in the amygdala. (B-F) The number of MOR-positive astrocytes, GABAergic neurons, and PV-positive neurons in the hippocampus (B), nucleus accumbens (C), periaqueductal gray (D), amygdala (E), and arcuate nucleus (F) from male (♂) and female (♀) MOR-mCherry mice.
© Exp Neurobiol