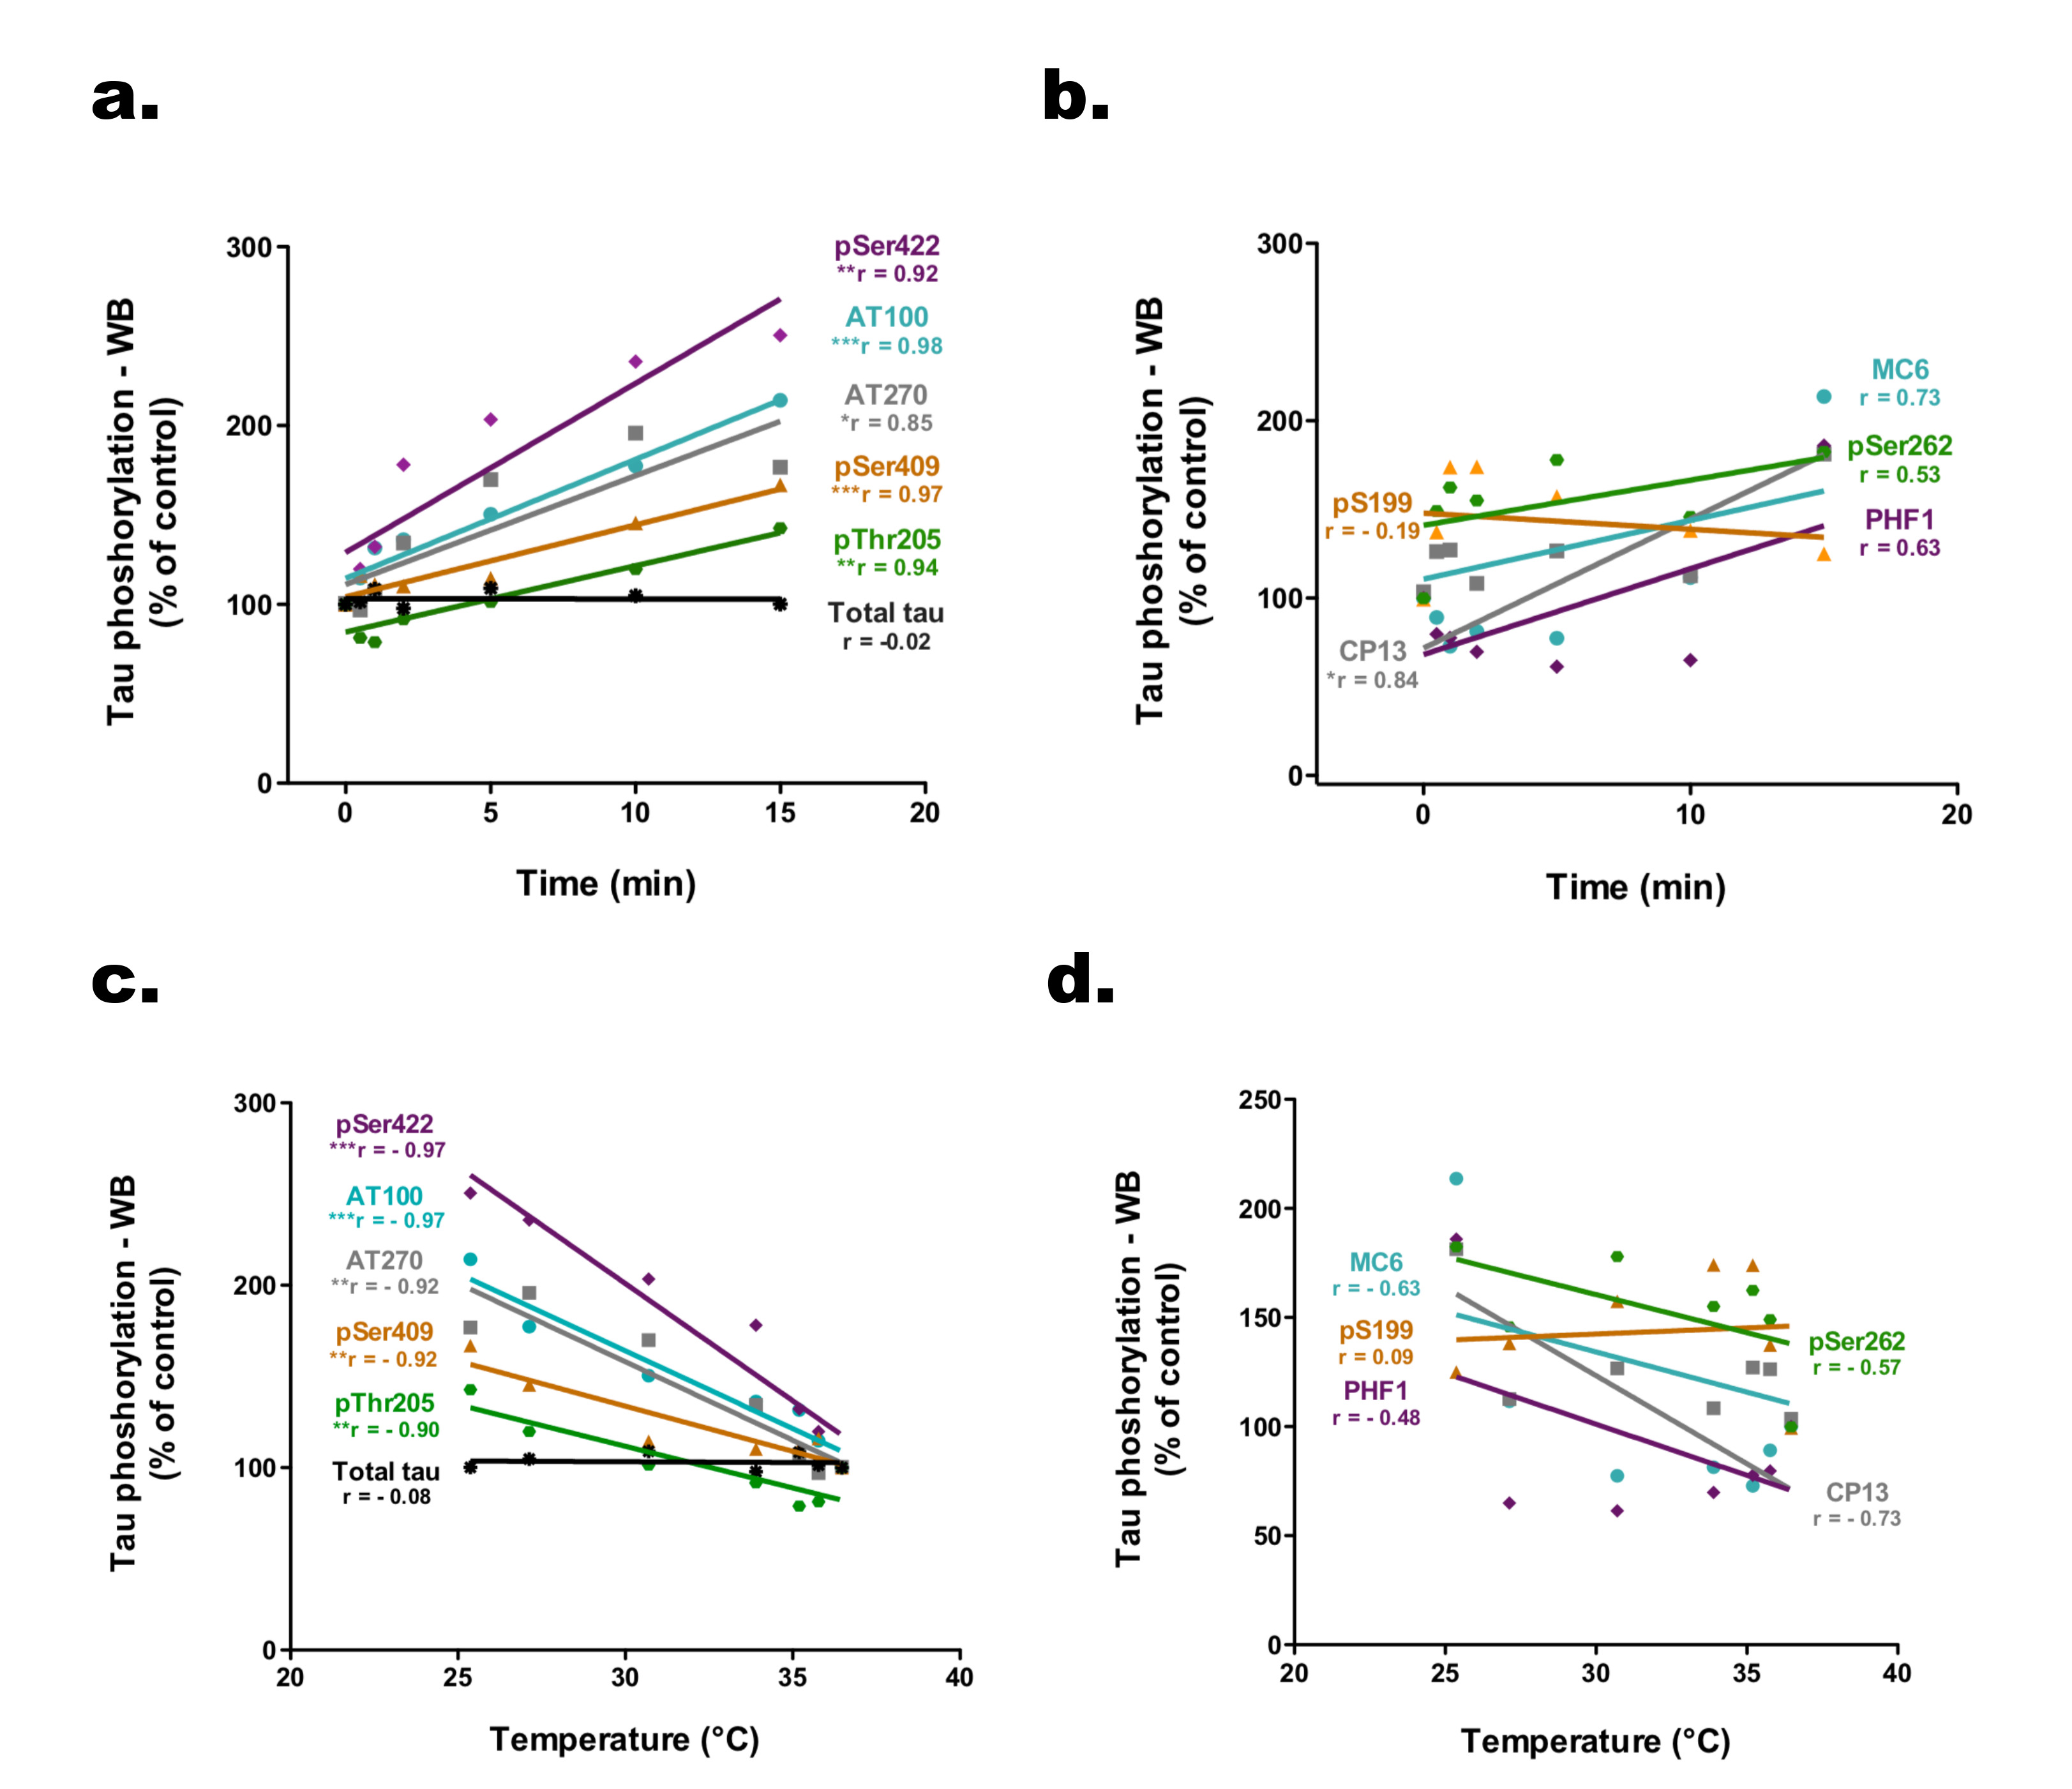
Fig. 3. . Significant correlation between tau hyperphosphorylation in SH3R cells and the duration of post-incubation sampling as well as the temperature of the cell medium. (A, B) Correlation between Tau phosphorylation level modification and time (for the following epitopes: pSer422, AT100, AT270, pSer409, pThr205, pSer199, CP13, MC6, pSer262, PHF1 and total tau). Each point represents the mean of the values obtained with immunoblot quantification. Statistical relationships were calculated with the r Pearson’s correlation coefficient (r values are indicated below each marker). *p<0.05, **p<0.01 and ***p<0.001. (C, D) Correlation between tau phosphorylation level modification and the mean temperature of cell medium (for the following epitopes: pSer422, AT100, AT270, pSer409, pThr205, pSer199, CP13, MC6, pSer262, PHF1 and total tau). Each point represents the mean of the values obtained with immunoblot quantification. Statistical relationships were calculated with the r Pearson’s correlation coefficient (r values are indicated below each marker). *p<0.05, **p<0.01 and ***p<0.001.
© Exp Neurobiol