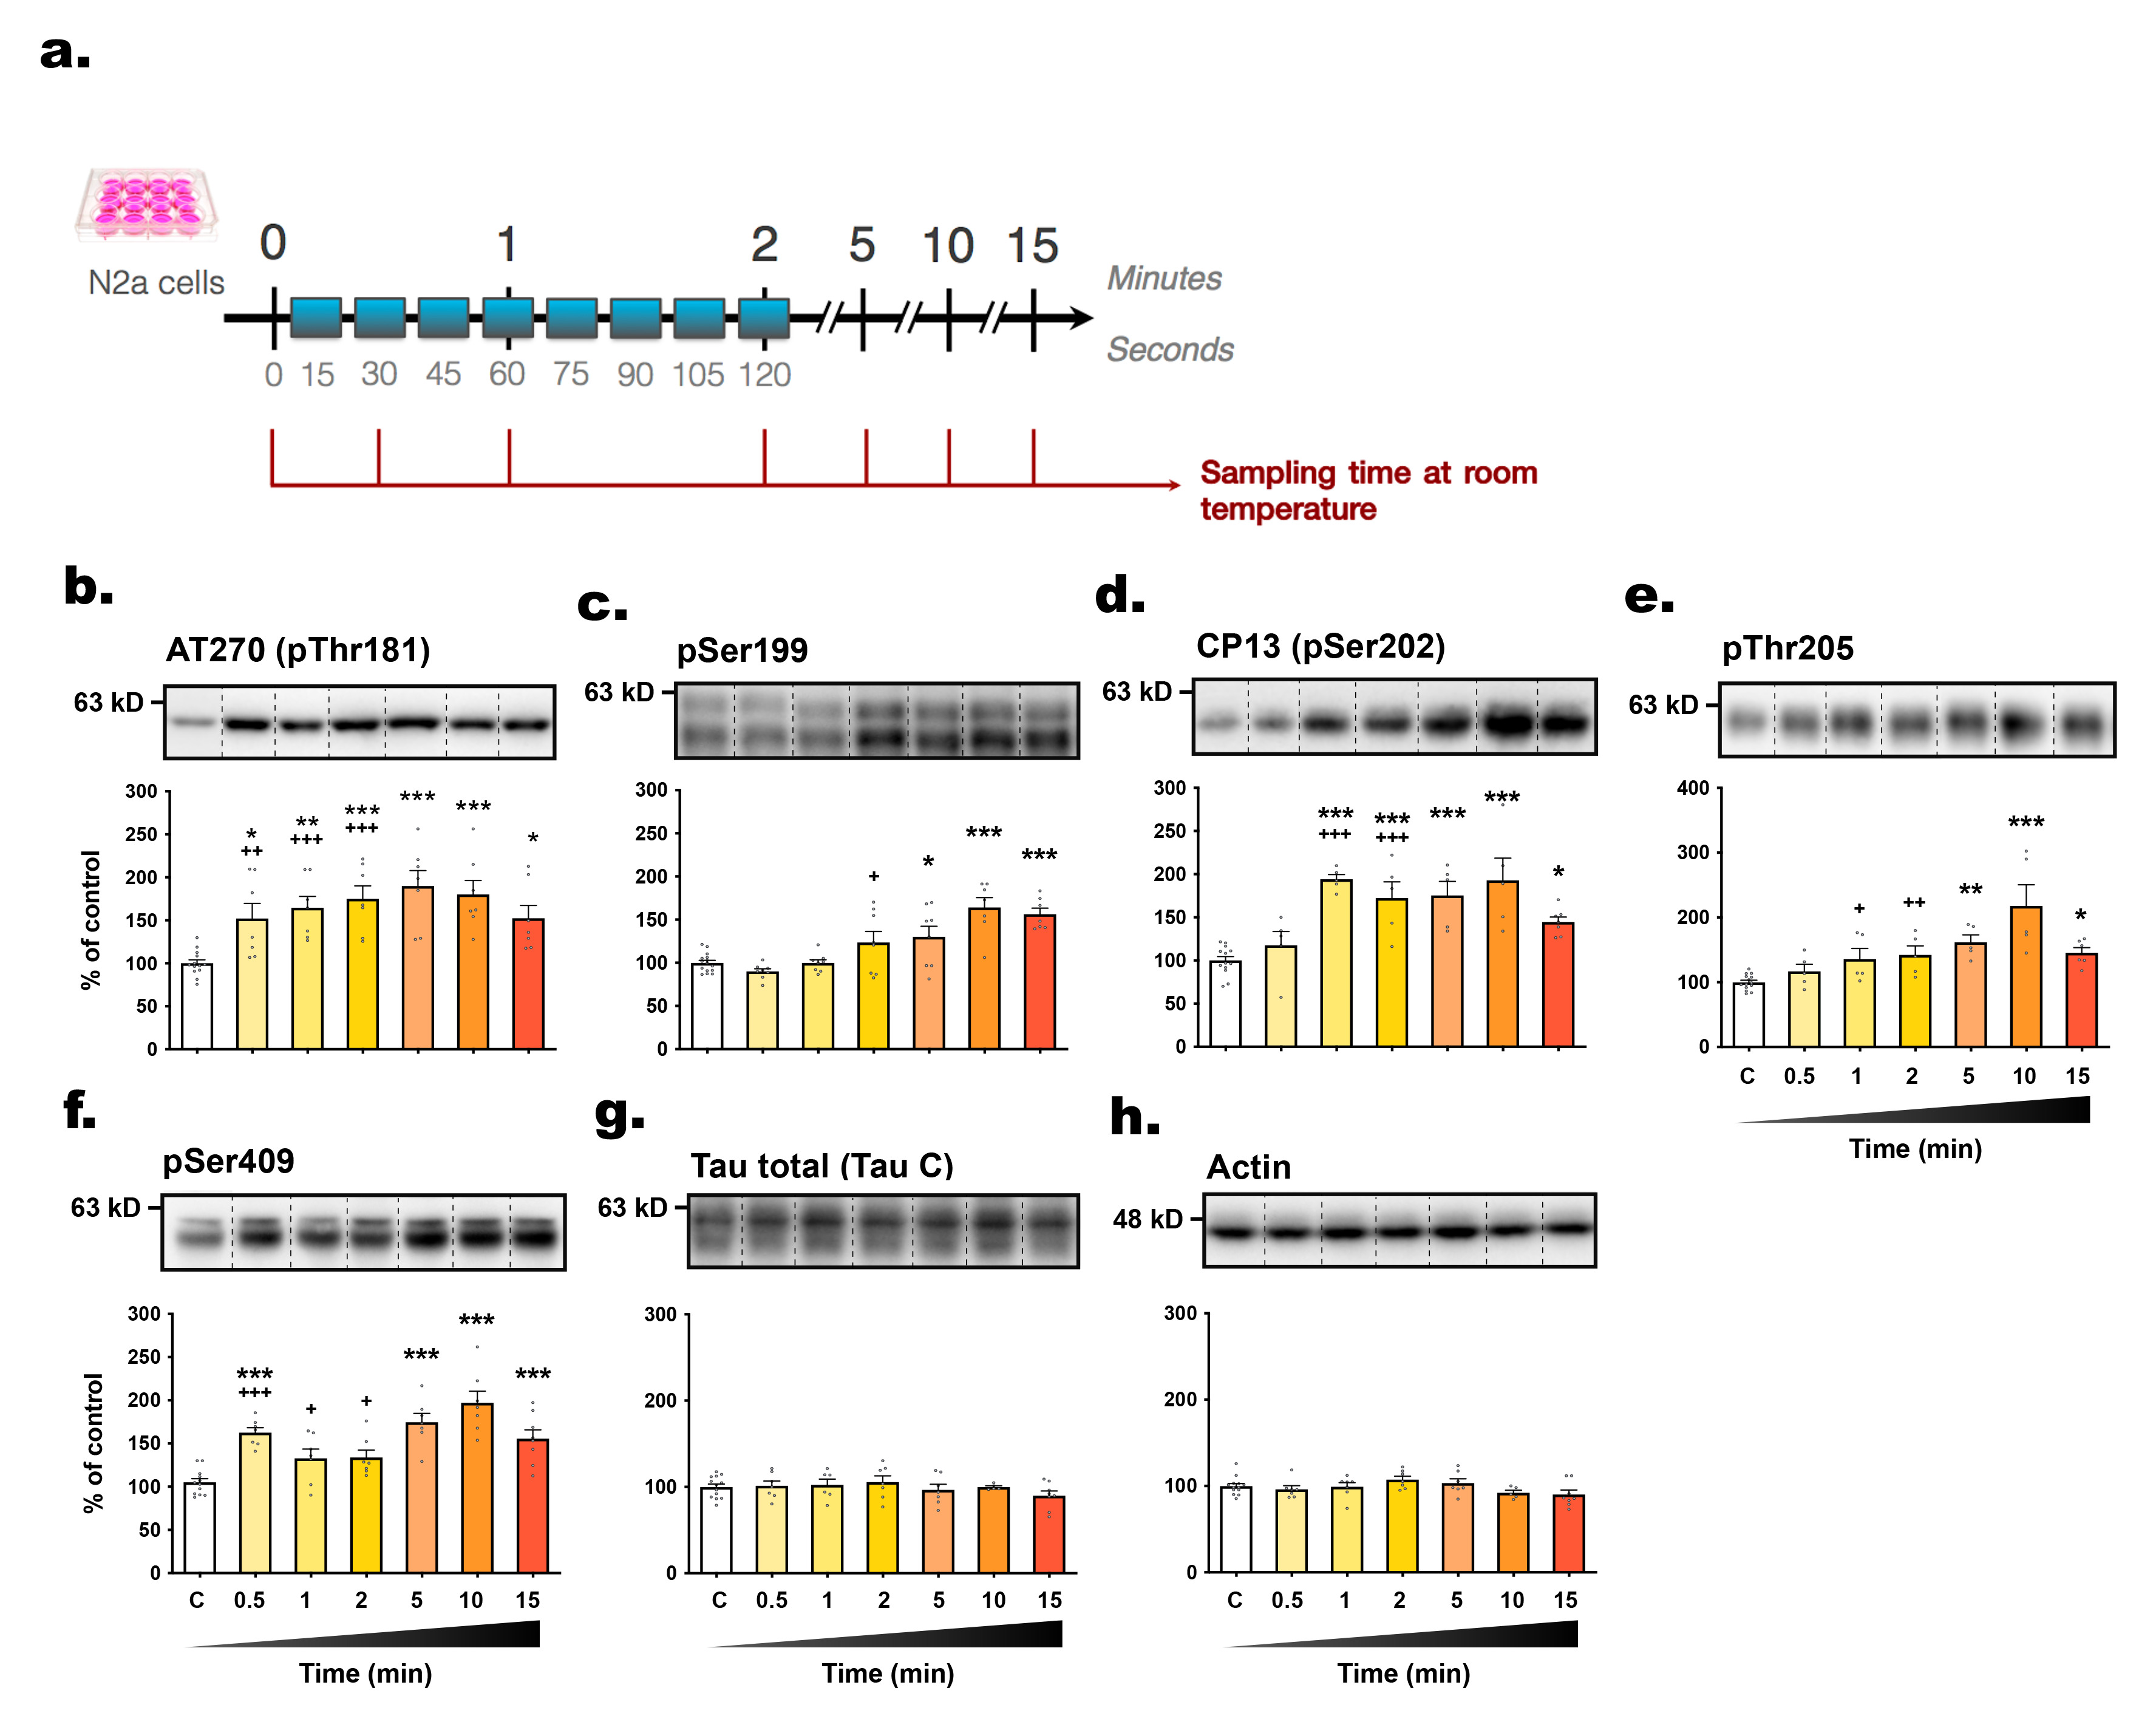
Fig. 4. The level of tau phosphorylation in N2a cells is rapidly affected by exposure to room temperature. (A) Experimental protocol. Cells in 6-wells plates were removed from incubators and were sampled immediately (t=0, control condition) or at t=0.5; 1; 2; 5; 10; 15 min (time spent at RT). The following antibodies were probed by immunoblot: (B) AT270 (pThr181), (C) pSer199, (D) CP13 (pSer202), (E) pThr205, (F) pSer409, (G) total tau and (H) β-actin. For each condition, a representative band is presented above graphs. For immunoblot quantification, each phospho-epitope level was normalized over total tau protein levels. Data are presented as mean±SEM and expressed as percentage of control condition (t=0). 1-way ANOVAs followed by Dunnett’s post-test were performed: AT270: F6,48=6.70 (p<0.0001); pS199: F6,54=12.92 (p<0.0001); CP13: F6,38=10.85 (p<0.0001); pT205: F6,38=9.38 (p<0.0001); pS409: F6,48=13.21 (p<0.0001); total tau: F6,46=0.83 (ns); actin: F4,47=1.91 (ns). *p<0.05, **p<0.01 and ***p<0.001 vs control condition. n=6~10 per condition. A second 1-way ANOVA followed by Dunnett’s post-test was performed only on the first timings (from t=0 to t=120 sec) : AT270: F3,31=11.69 (p<0.0001); pS199: F3,35=4.84 (p<0.01); CP13: F3,30=11.70 (p<0.0001); pT205: F3,31=4.85 (p<0.01); pS409: F3,29=12.56 (p<0.0001). +p<0.05, ++p<0.01 and +++p<0.001 vs. control condition.
© Exp Neurobiol