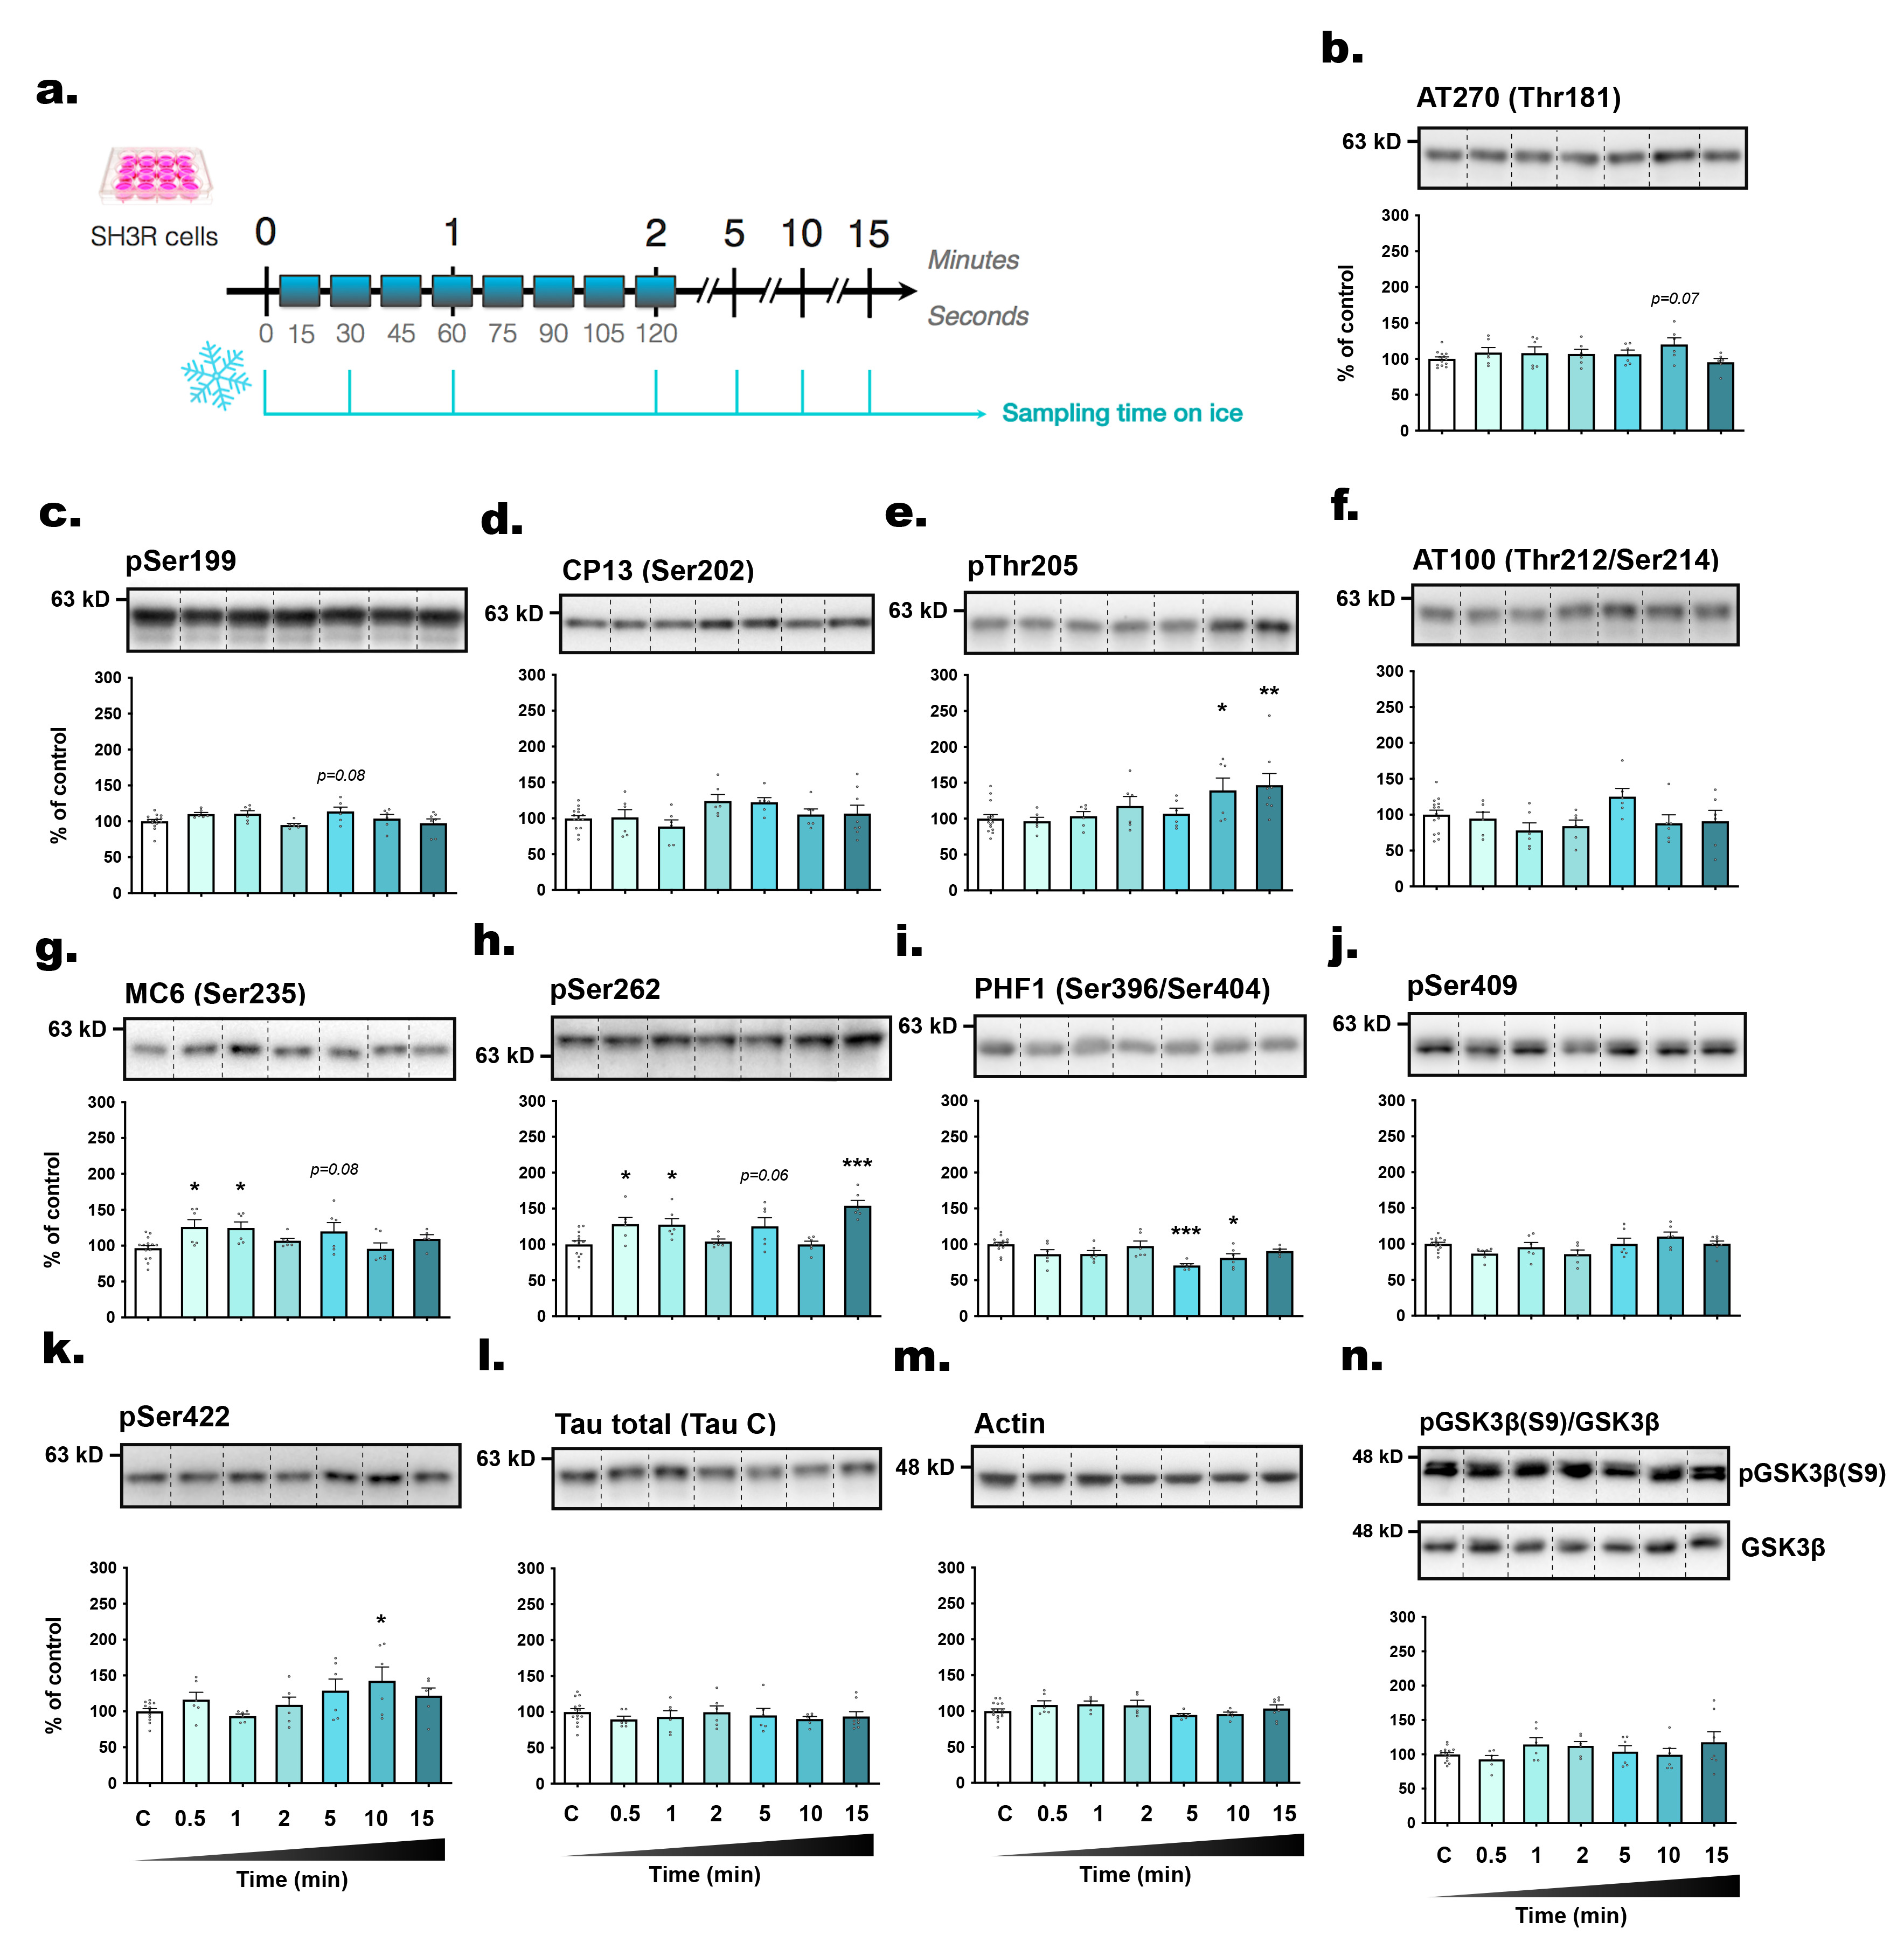
Fig. 5. Putting SH3R cell plates on ice blocked the induction of tau phosphorylation following removal from the incubator. (A) Experimental protocol. Cells in 6-wells plates were removed from incubators and were sampled immediately (t=0, control) or at t=0.5; 1; 2; 5; 10; 15 min (time spent on ice). The following antibodies were probed by immunoblot: (B) AT270 (pThr181), (C) pSer199, (D) CP13 (pSer202), (E) pThr205, (F) AT100 (pThr212/Ser214), (G) MC6 (pSer235), (H) pSer262, (I) PHF1 (pSer396/404), (J) pSer409, (K) pSer422, (L) total tau and (M) β-actin and (N) ratio of inactive pGSK3β(pSer9)/GSK3β. For each condition, a representative band is presented above graphs. For immunoblot quantification, each phospho-epitope level was normalized over total tau protein levels. Data are presented as mean±SEM and expressed as percentage of control condition (t=0). 1-way ANOVAs followed by Dunnett’s post-test were performed: AT270: F6,42=1.61 (ns); pS199: F6,45=2.67 (p<0.05); CP13: F6,46=2.07 (ns); pT205: F6,45=3.53 (p<0.01); AT100: F6,43=2.00 (ns); MC6: F6,43=3.27 (p<0.01); pS262: F6,42=7.26 (p<0.0001); PHF1: F6,42=5.34 (p<0.001); pS409: F6,45=2.67 (p<0.05); pS422: F6,41=2.52 (p<0.05); total tau: F6,45=0.42 (ns); actin: F6,44=1.66 (ns); ;pGSK3β(pSer9): F4,34=2.05 (ns). *p<0.05, **p<0.01 and ***p<0.001 vs. control condition. n=6~10 per condition.
© Exp Neurobiol