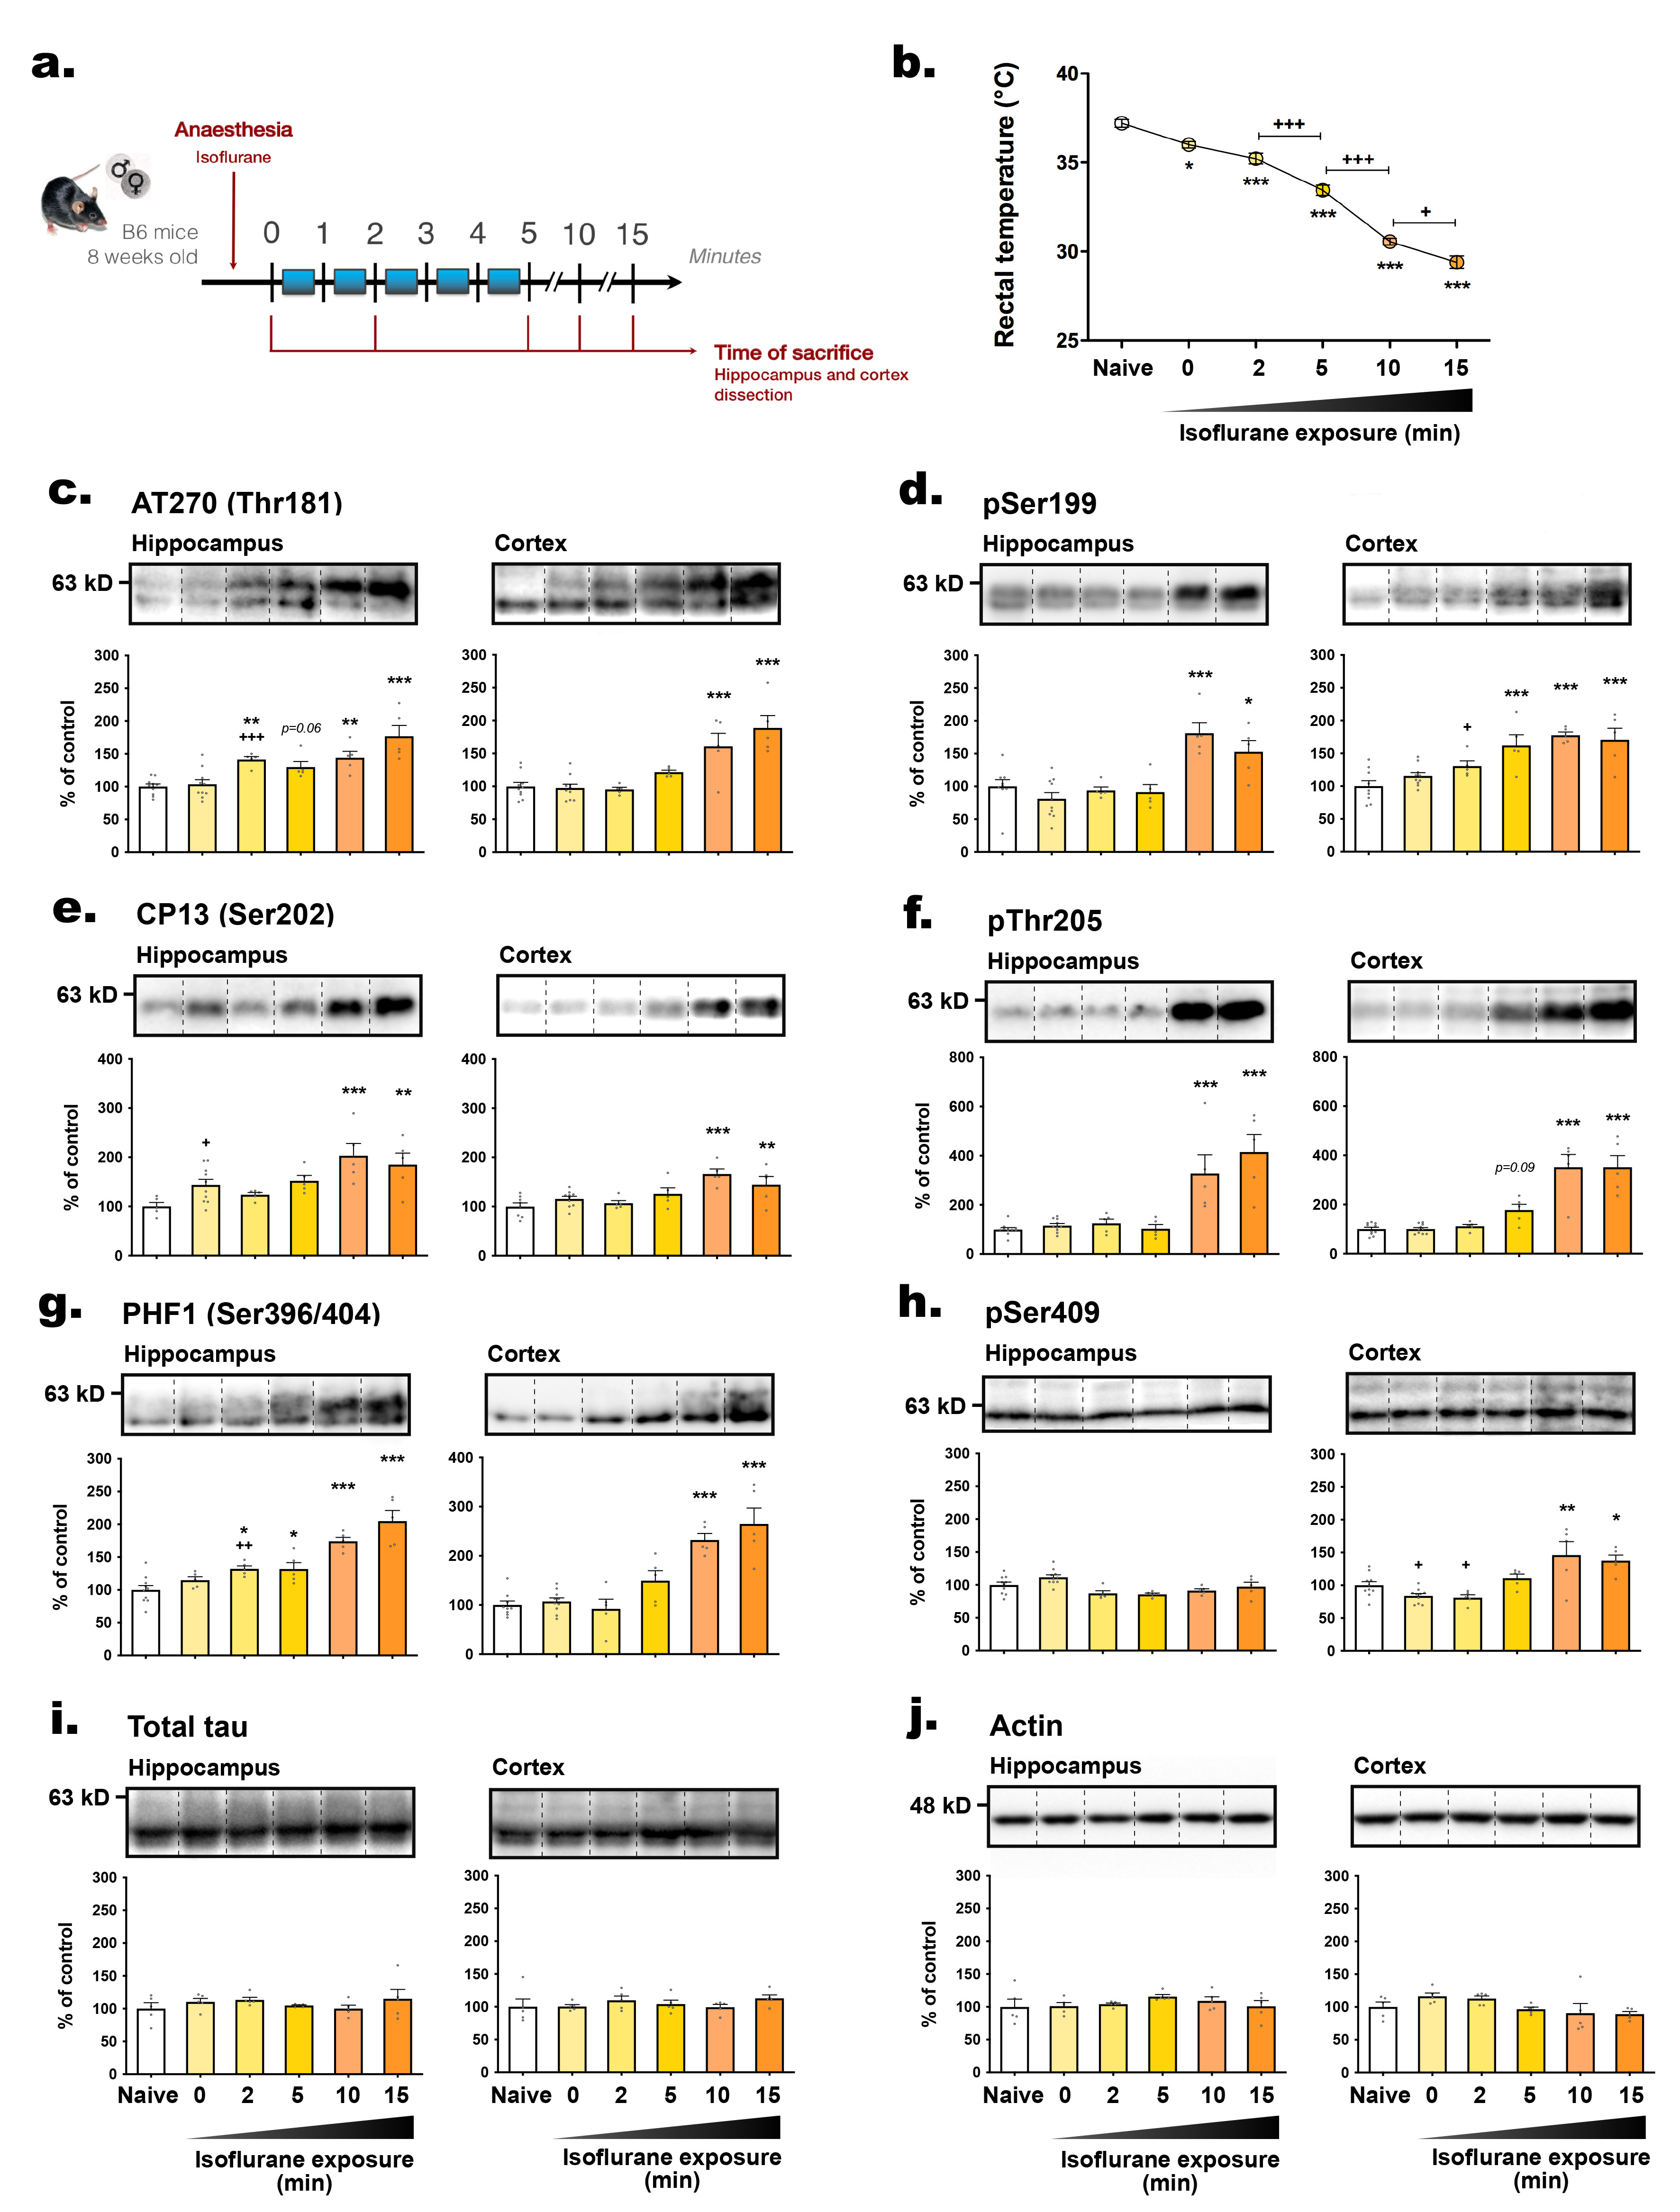
Fig. 6. Tau hyperphosphorylation occurs after hypothermia induced by anesthesia. (A) Experimental protocol. C57BL6 mice (both males and females) were euthanatized by decapitation immediately (naive, control condition) or after exposure to isoflurane: t=0 (deep sleep); 2; 5; 10; 15 min. Brains were immediately removed and hippocampi and cortices were dissected and frozen for Western blot analysis. (B) Just before euthanasia, rectal temperature was assessed. 1-way ANOVA followed by Tukey’s post-test was performed, F5,24=139.6 (p<0.0001). *p<0.05 and ***p<0.001 vs. naive. +p<0.05 and +++p<0.001 vs. indicated group. n=5 per group. The following antibodies were probed by immunoblot: (C) AT270 (pThr181), (D) pSer199, (E) CP13 (pSer202), (F) pThr205, (G) PHF1 (pSer396/404), (H) pSer409, (I) total tau and (J) β-actin. For each condition, a representative band is presented above graphs. For immunoblots quantification, each phospho-epitope level was normalized over total tau protein levels. Data are presented as mean±SEM and expressed as percentage of control condition (naive). n=5~10 per condition. For each hippocampus and cortex analysis, a 1-way ANOVA followed by Dunnett’s post-test was performed: Hippocampus AT270: F5,34=12.41 (p<0.0001); Cortex AT270: F5,34=13.73 (p<0.0001); Hippocampus pS199: F5,33=10.26 (p<0.0001); Cortex pS199: F5,33=10.80 (p<0.0001); Hippocampus CP13: F5,29=5.33 (p<0.01); Cortex CP13: F5,32=6.81 (p<0.001); Hippocampus pT205: F5,34=14.92 (p<0.0001); Cortex pT205: F5,34=25.23 (p<0.0001); Hippocampus PHF1: F5,29=20.90 (p<0.0001); Cortex PHF1: F5,33=20.90 (p<0.0001); Hippocampus pS409: F5,34=5.42 (p<0.001); Cortex pS409: F5,34=9.88 (p<0.0001); Hippocampus total tau: F5,24=0.74 (ns); Cortex total tau: F5,24=0.71 (ns); Hippocampus actin: F5,24=0.75 (ns); Cortex actin: F5,24=2.23 (ns) vs. naive. *p<0.05, **p<0.01 and ***p<0.001 vs. control condition. A second 1-way ANOVA followed by Dunnett’s post-test was performed only on the first groups (naive, t=0 and t=2 min): Hippocampus AT270: F2,22=10.84 (p<0.0001); Cortex AT270: F2,22=0.12 (ns); Hippocampus pS199: F2,21=1.10 (ns); Cortex pS199: F2,21=3.80 (p<0.05); Hippocampus CP13: F2,17=4.01 (p<0.05); Cortex CP13: F2,20=1.84 (ns); Hippocampus pT205: F2,22=1.52 (ns); Cortex pT205: F2,22=0.57 (ns); Hippocampus PHF1: F2,17=5.98 (p<0.05); Cortex PHF1: F2,21=0.41 (ns); Hippocampus pS409: F2,22=7.10 (p<0.01); Cortex pS409: F2,22=4.62 (p<0.05). +p<0.05 and +++p<0.001 vs. control condition.
© Exp Neurobiol