Articles

Article Tools
 View Full Text View Full Text |
 Abstract Abstract |
 Article as PDF Article as PDF |
 Print this Article Print this Article |
 Pubmed Pubmed |
 PMC PMC |
 PubReader PubReader |
 Export to Citation Export to Citation |
 Email Alerts Email Alerts |
 Open Access Open Access |
Share this article on :


Stats or Metrics
Article
Original Article
Exp Neurobiol 2015; 24(3): 235-245
Published online September 30, 2015
https://doi.org/10.5607/en.2015.24.3.235
© The Korean Society for Brain and Neural Sciences
The Unreliability of MTT Assay in the Cytotoxic Test of Primary Cultured Glioblastoma Cells
Hwa Yeon Jo1,2,3, Yona Kim1,2,3, Hyung Woo Park1,2,3, Hyo Eun Moon1,2,3, Seongtae Bae1,2,3, JinWook Kim1,2,3, Dong Gyu Kim1,2,3 and Sun Ha Paek1,2,3*
1Department of Neurosurgery, 2Cancer Research Institute, and 3Ischemic/Hypoxic Disease Institute,Seoul National University College of Medicine, Seoul 03082, Korea
Correspondence to: *To whom correspondence should be addressed.
TEL: 82-2-2072-3993, FAX: 82-2-744-8459
e-mail: paeksh@snu.ac.kr
MTT assay is commonly used to assess the cellular cytotoxicity caused by anticancer drugs in glioblastomas. However, there have been some reports insisting that MTT assay exhibited non-specific intracellular reduction of tetrazolium which led to underestimated results of cytotoxicity. Here, we examine whether or not MTT assay can lead to incorrect information regarding alcohol-induced cytotoxicity on immortalized and primary glioblastoma cells. MTT assay was applied to assess the ethanol-induced cytotoxicity at various ethanol concentrations. The cellular cytotoxicity induced by different doses of ethanol was analyzed and compared through several cytotoxic assays. Ethanol-induced cytotoxicity observed through MTT assay on both cell types was shown to be ethanol dose-dependent below a 3% concentration. However, the cytotoxicity was shown to be markedly underestimated only in primary cells at a 5% concentration. RT-PCR and Western Blot showed increased expressions of pro-apoptotic proteins and decreased expressions of anti-apoptotic proteins in an ethanol dose-dependent manner in both cell types. Furthermore, we present a possible mechanism for the unreliable result of MTT assay. A high concentration of ethanol induces more severe membrane damage and increased intracellular concentration of NADH in primary cells which enhances the nonspecific reduction of tetrazolium salt. Together, our findings demonstrate that the cytotoxicity on primary cells could inaccurately be assessed when detected through MTT assay. Therefore, a careful interpretation is needed when one would analyze the cytotoxic results of MTT assay, and it is suggested that other assays must be accompanied to produce more reliable and accurate cytotoxic results on primary glioblastoma cells.
Keywords: primary cell, ethanol, Tetrazolium salts, non-specific intracellular reduction
INTRODUCTION
Tetrazolium salts have widely been used to study the mitochondrial respiratory chain since the 1960s [1,2]. Since then, MTT assay, which uses tetrazolium salt known as 3-(4,5-dimethyl-2-thia-zolyl)-2, 5-diphenyl-2H-tetrazolium bromide), has been a powerful biological tool to measure cell proliferation and cytotoxicity. MTT assay is an easy and comfortable colorimetric method [3]. Reduction of MTT is associated with the flavin-containing enzyme, which is a well-known mitochondrial enzyme, and this suggests that mitochondria are the main site of MTT reduction [4]. However, MTT reduction has overlooked many intracellular reductases. Several studies have recently shown that reduction of tetrazolium salts is related not only with mitochondria reductase, but also with many intracellular reductases [5,6]. Intracellular reductases have been shown to reduce tetrazolium salts via non-mitochondrial reduction pathway. Numerous other intracellular environmental factors can affect MTT reduction. Many studies have indicated that intracellularly reduced nicotinamide adenine dinucleotide (NADH) is the main electron donor in MTT reduction [3,5]. Therefore, a high NADH concentration may lead to inaccurate MTT assay results.
Ethanol is a well-known factor that increases the intracellular concentration of NADH. Several studies have already reported that Tetrazolium salts can cause nonspecific reactions by a particular agent [4,5]. However, it is currently unclear whether or not different types of cells can lead to different MTT reduction response. And furthermore, it is not known if MTT reduction response would be different between patient-derived primary glioblastoma cells and immortalized glioblastoma cell lines. The immortalized glioblastoma cell line has experienced the process of immortalization and would lose or acquire some functional or structural changes [7]. On this basis, we hypothesized that primary cells that have a relatively large cell size would have simple to more severe membrane damage and intercellular movement of material. And accordingly, the amount of tetrazolium salts per cell in primary glioblastoma cells would be increased which would lead to the enhancement of the color reaction of the MTT assay. As a result, such cellular environments would result in increased nonspecific reactions of tetrazolium. To explore this hypothesis, we designed an experiment to investigate and compare the ethanol induced-cytotoxicity between primary glioblastoma cells and immortalized glioblastoma cell lines through several cytotoxicity assays with the goal of questioning the reliability of MTT assay in the estimation of the ethanol-induced cytotoxicity.
MATERIALS AND METHODS
Fresh human tissue samples were obtained with the required Institutional Review Board (IRB) approval from Seoul National University Hospital (IRB number: 0106-080-001).
Two types of primary glioblastoma cells (GBL-13 and GBL-15) and two types of glioblastoma cell lines (U87MG and U373MG) were used for this study. The U87MG (human glioblastoma) cell line was obtained from the American Type Culture Collection (ATCC; Manassas, VA, USA). The U373 (human glioblastoma) cell line was acquired from the Korean Cell Line Bank (KCLB: Seoul, Korea). GBL-13 and GBL-15 were obtained during brain tumor lobectomy. After pathological analysis, brain tumor was diagnosed as glioblastoma. The tumor mass was processed to a single cell by papain digestion. These primary cells were cultured with Dulbecco Modified Eagled Medium (DMEM, WelGENE, LM001-05, Korea) containing 10% fetal bovine serum (FBS, Gibco Corp.,16000, Grand Island, NY, USA) and 100 U/ml penicillin/streptomycin (Gibco Corp.,15140-122, Grand Island, NY, USA) in a humidified incubator with 5% CO2 at 37℃ and were passaged by trypsinization using TrypLE™ (Gibco Corp.,12604-013, Grand Island, NY, USA) every 7~8 days. U87MG and U373MG were cultured with 10% FBS (FBS, Gibco Corp.,16000, Grand Island, NY, USA), supplemented Eagle's Minimum Essential Media (MEM, WelGENE., LM001-05, Korea) containing 100 U/ml penicillin/streptomycin (Gibco Corp.,15140-122, Grand Island, NY, USA) in 5% CO2 incubator at 37℃ and were passaged by TrypLE™ (GibcoCorp.,12604-013, Grand Island, NY, USA) every 3~4 days.
Cells were plated at a density of 3×10³ cells per each well into 96-multiwell plate for 24 h (Falcon, 353072, Franklin Lakes, USA). A day after the initial plating, cells were treated and cultured in the same ethanol diluted growth media containing six different dilution concentrations of ethanol (EtOH, Absolute Ethanol 99.9%. Duksan Pure Chemicals Co., Gyeonggi, Korea). Ethanol concentrations were as follows: 0%, 0.1%, 0.5%, 1%, 3% and 5% v/v. Ethanol containing media were changed after 24 h, 48 h and 72 h from the initial planting. The cells were cultured in ethanol diluted growth media with 5% CO2 incubation at 37℃ during the whole test periods.
The MTT assay was applied to evaluate the ethanol effects in proliferation and viability of glioblastoma cells. MTT salt is cleaved by mitochondrial dehydrogenase in the metabolic active cells and is reduced to an insoluble formazan crystal which displays a purple color. The color was detected by a Multi-scan MS spectrophotometer (Labsystems, Stockholm, Sweden). The In vitro Cell Proliferation KIT 1 (Roche, 11465007001, Mannheim, Germany) was used. U87MG, U373MG, GBL-13 and GBL-15 were seeded at a density of 3×10³ cells/well in 96-well plate. After ethanol treatment, 10 µl of MTT (5 µg/ml) were added to every single well in the plate which was incubated for 4 h at 37℃. Then 100 µl of solubilization buffer (SDS 10% in 0.01N HCl) were added to the wells in the plate which was incubated at 37℃ overnight. After the incubation, the absorbance was measured at 570 nm in a Multiscan MS spectrophotometer (Labsystems, Stockholm, Sweden).
After the treatment of 5% ethanol for 24 h, morphological changes of the cells were observed by phase contrast microscopy (Nikon, TS100, Japan).
The cells were plated in 96-well plate. After ethanol treatments, cells attached on the 96-well plate were washed using phosphate-buffered saline (PBS, pH 7.4) once, trypsinized for 1 min with TrypLE™ (GIBCO Corp.,12604-013) at 37℃ incubator and then neutralized with fetal bovine serum (FBS) supplemented growth media. The cells were stained using 4% trypan-blue to determine live cells. Cell count was performed manually with a hemocytometer. Counting was at minimum triplicated samples, and experiments were performed at least three times.
The CytoTox-Glo cytotoxicity assay (Promega Corp., G9292, WI, U.S.A.) was employed to evaluate the cytotoxicity effects of ethanol on glioblastoma cells. The CytoTox-Glo cytotoxicity assay distinctively quantifies the extracellular activity of an intracellular protease (dead-cell protease). Intracellular protease is associated with cytotoxicity and reacts with a luminogenic peptide substrate (alanyl-alanylphenylalanyl-aminoluciferin). The degree of protease reaction can measure dead-cell protease activity. As a control, we treated 1% TritonX-100 to exclude the background value of media color. 5 µl of luminogenic peptide substrate was added to each well to measure the luminescence to determine the number of dead cells. The peptide substrate was incubated for 15 min at 37℃. The luminescence was measured in a 1420 Luminescence Counter (Perkin Elmer, Waltham, MA). To determine the total number of cells, we measured luminescence by adding 50 µg of lysis reagent to each well of the plates. The luminescence was incubated for 15 min at 37℃. To calculate viability, luminescence was measured before and after lysis. The calculating formula used is described below. The luminescence value before lysis is the experimental dead cell luminescence and after lysis is the total luminescence (Viable cell luminescence=Total luminescence-Experimental dead cell luminescence).
Lactate dehydrogenase (LDH) was applied to evaluate the quantification of plasma membrane damage and cytotoxicity. We conducted LDH assay with the LDH-Cytotoxicity Assay Kit (LDH, BioVision Inc., K311-400, SF, USA) adhering to the manufacturer's protocol. In brief, 1×10⁴ cells were seeded in 96-well plate with 1% assay medium and were exposed to ethanol for 24 h in an incubator (5% CO2, 90% relative humidity, 37℃). Then the 96-well plate was centrifuged at 250 g for 10 min. 100 µl of supernatant was transferred into a new 96-well plate. Then, 100 µl reaction was added and incubated for 30 min at room temperature. After incubation, the absorbance of the solution was measured at 492 nm using a Multi-scan MS spectrophotometer (Labsystems, Stockholm, Sweden). LDH levels in the media were quantified and compared to control values according to the kit instructions.
Total RNA was extracted using the RNeasy Mini Kit (Qiagen, Inc. Valencia, CA, U.S.A.) at the 24 h ethanol treatment. Total RNA was reverse transcribed using the Reverse Transcription System (Promega, A3500, WI, USA) as per instructions. The primers used were as follows: Bax, (forward: 5'-AGGATGCGTCCACCAAGAAG-3') and (reverse: 5'-GCTCCCGGAGGAAGTCCAAT-3'), Bcl-2, (forward: 5'-GACTTCGCCGAGATGTCCAG-3') and (reverse: 5'-CATCCCAGCCTCCGTTATCC-3'), Fas, (forward: 5'-GGACCCTCCTACCTCTGGTTCTT-3') and (reverse: 5'-CAGTCCCTAGCTTTCCTTTCACC-3'), and GAPDH, (forward: 5'-CGTGGAAGGACTCATGAC-3') and (reverse: 5'-CAAATTCGTTGTCATACCAG-3'). 30 cycles polymerase chain reaction (PCR) was performed for amplification of these products with each cycle, which consists of denaturation at 94℃ for 30 s, annealing at Tm (melting temperature) for 30 s and primer extension at 72℃ for 1 min. PCR products were separated on 1.5% agarose gel (Bioline, BIO-41025, London, U.K.) and were visualized by RAS-3000 (FUJI, RAS-3000, Japan).
After 24 h of ethanol treatment, four types of cells were collected and the proteins were isolated. The proteins were extracted using PRO-PREP, (iNtRON Biotechnology Inc., 17081, Sungnam, Korea). 10 µg proteins were electrophoresed on 10% SDS-PAGE and were transferred to a polyvinylidene fluoride (PVDF) membrane. (GE Healthcare, RPN 2020F, Buckinghamshire, UK). In the case of cleaved form such as caspase-3 and caspase-9, 30 µg proteins were used and 0.2 µm pore size PVDF membrane (Millipore Corporation, ISEQ00010, Billerica, MA, USA) was applied. After blocking the membrane with 5% (w/v) skim milk (BD Biosciences, 232100, CA, USA) and washing with Tris-buffered saline-Tween solution (TBST), membranes were incubated with anti-BCL-2 (1:1000), anti-Bax (1:1000), anti-caspase-3 (1:1000), anti-caspase-9 (1:1000) (Cell Signaling Technology, Inc., MA, USA), and β-actin (1:500) antibodies (Santa Cruz Biotechnology, Santa Cruz, CA, USA), for 12 h at 4℃, respectively. After washing with TBST, the membranes were incubated with horseradish peroxidase-conjugated goat anti-rabbit IgG (1:1000, Vector labs,. PI-1000) or goat anti-mouse IgG (1:1000, Vector labs, PI-2000, CA, USA) or rabbit anti-goat IgG secondary antibodies (1:1000, Vector labs, PI-9500, CA, USA) for 1 h~2 h at room temperature. After washing with TBST, signals were detected using enhanced chemiluminescence, ECL Western Blot Detection Kit (BIOSESANG, W6001, Seoul, Korea) on the membrane.
Nicotinamide nucleotide is a main indicator of the redox state in cells. Intracellular nucleotides such as NAD and NADH ratios were detected by the NAD+/NADH Quantification kit (BioVision, Inc. K347-100, SF, USA). This assay was performed adhering to the manufacturer's protocol. In short, U87MG, U373MG, GBL-13 and GBL-15 were treated with ethanol at specific concentrations of 0%, 1%, and 5% and incubated for 24 h (5% CO2, 90% relative humidity, 37℃). Then, the 2×10⁵ cell pellet was collected (2000 rpm, 5 min) for the NAD+/NADH measurement per each assay. The cell pellet was extracted by Extraction Buffer through the freeze/thaw cycle method. Then, the extraction sample was briefly vortexed and spun down at 14,000 rpm for 5 min. Only supernatant was applied in an e-tube. To detect the total NAD/NADH (NADt), 50 µl of the extracted supernatant was placed into 96-well plate. Heat was applied to the supernatant sample at 60℃ for 30 min in a water bath to detect NADH only. Throughout this process, all NAD was decomposed while the NADH remained intact. The samples were then cooled on ice. 50 µl of NADH samples were then placed in 96-well plate. 100 µl of Cycling Mix was also added in each well. Afterwards, 5 min plate incubation was applied at room temperature, and 10 µl of developer was continuously added. The plates were incubated for 1 to 4 hours and 10 µl of stop solution were added. Finally, the plates were read at 450 nm by a Multiscan MS spectrophotometer (Labsystems, Stockholm, Sweden). And finally, the amount of NADt and NADH (pmol) and NAD/NADH Ratio was calculated (NAD/NADH Ratio = (NADt - NADH)/NADH).
The CCK-8 assay (WST-8, Dojindi labs, Kumamoto, Japan) was applied to evaluate the effects of ethanol for proliferation and viability of the cells used. CCK-8 assay uses water soluble tetrazolium salt that is called WST-8 [2-(2-methoxy-4-nitrophenyl)-3-(4-nitrophenyl)-5-(2,4-disulfophenyl)-2H-tetrazolium, monosodium salt]. WST-8 produces a water soluble formazan dye according to the dehydrogenase activity in the presence of an electro mediator. Through this process, colorless WST-8 becomes WST-8 formazan with an orange color. CCK-8 assay was used by following the manufacturer's instructions. U87MG, U373MG, GBL-13 and GBL-15 were seeded at a density of 3000 cell/well in 96-well plate and were treated with ethanol at the concentrations of 0, 0.1, 0.5, 1, 3 and 5%. And then the plates were incubated for 24 h, 48 h and 72 h at 5% CO2, 90% relative humidity, and 37℃. After incubation, 10 µl of CCK-8 solution was added to each well of the 96-well plate and the wells were incubated for 1~4 hours. Finally, the absorbance at 450 nm was evaluated using a Multiscan MS spectrophotometer (Labsystems, Stockholm, Sweden).
All data are expressed as means±standard deviation (SD). Statistical significance between different test conditions was determined by using the Mann-Whitney U test. The differences between groups were considered significant at p<0.05. Statistical analysis was performed using GraphPad Prism 5 software (GraphPad Prism, San Diego, California, U.S.A.).
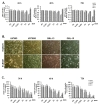
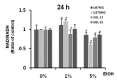
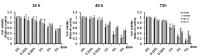
Cells were examined by MTT-assay to determine the ethanol-induced cytotoxicity. Ethanol exposure showed that cytotoxicity for two glioblastoma cell lines (U87MG and U373MG) and two primary glioblastoma cells (GBL-13 and GBL 15) was increased in a time- and ethanol concentration-dependent manner (Fig. 1). The viabilities of U87MG and U373MG were reduced as the ethanol concentration was increased (Fig. 1A, 1C). The viability of U87MG was significantly decreased to 82%, 66%, and 42% at ethanol concentrations of 1%, 3% and 5%, respectively, at 72 h. In the case of U373MG, cell viability was also dramatically decreased to 38% in the 5% ethanol-treated group at 72 h (Fig. 1A). However, different patterns were observed for the primary glioblastoma cells in the MTT assay (Fig. 1A). These cells - GBL-13 and GBL-15 - seemed to be affected by the treatments with low dose ethanol concentration, in a similar pattern as the two glioblastoma cell lines (Fig. 1A). However, intriguingly, when the higher dose of ethanol was treated, the MTT assay revealed significantly increased cell viabilities in primary glioblastoma cells, especially at the 5% ethanol concentration (Fig. 1A).
Cells were counted by trypan blue exclusion assay to determine the effect of actual ethanol-induced cytotoxicity on glioblastoma cells (Fig. 1C). The experimental condition was the same as the MTT assay described previously; 0%, 0.5%, 1%, 3%, and 5% ethanol treated media were used. The number of viable cell for U87MG and U373MG was found to be gradually decreased as the ethanol concentration was increased (Fig. 1C). The number of viable cells of the cell line was reduced to almost less than 5% at 72 h of the 5% ethanol treatment. Likewise, primary glioblastoma cells -GBL-13 and GBL-15 - exhibited decreased number of viable cell in an ethanol concentration-dependent manner (Fig. 1C). When the 5% ethanol was treated, the viability of the primary glioblastoma cells was found to be significantly dropped to less than 20% at 72 h.
As expected, every type of cell used in this study underwent morphological changes when ethanol was treated compared to the control (Fig. 1B). Cell density was decreased and the size of the most cells in the 5% ethanol-treated group was shrunk compared with the control one. Cell pictures of the 5% ethanol treatment are only shown because the MTT results of the 5% ethanol treatment were not found to match with the results obtained from the trypan blue exclusion assay and the microscopic images of the cells treated with ethanol. (Nikon, ECLIPSS, TS100, Japan).
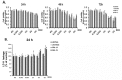
CytoTox-Glo cytotoxicity assay (Promega Corp., G9292, WI, U.S.A.) was used to examine dead-cell protease activity which measured the ethanol-induced cytotoxicity on glioblastoma cell lines and primary cells (Fig. 2A). Accordingly, cell viability was calculated using the formula: Viable cell luminescence=Total luminescence-Experimental dead cell luminescence. Through CytoTox-Glo cytotoxicity assay, it was shown that the viability of U87MG and U373MG apparently declined to 43% and 30%, respectively, at a 5% ethanol concentration at 72 h. Likewise, the viability of primary glioblastoma cells - GBL-13 and GBL-15 - was decreased to 39% and 50%, respectively, at a 5% ethanol concentration at 72 h. Through this assay, it was found that the cell viabilities of U87MG and U373MG were reduced in an ethanol concentration-dependent manner, and that a very similar pattern was also observed for the primary glioblastoma cells. These results clearly suggest that ethanol induced the cytotoxicity not only on the glioblastoma cell lines but also on the primary glioblastoma cells.
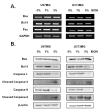
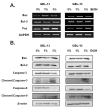
The generation of reactive oxygen species (ROS) and oxidative stress leads to DNA damage and ultimately cellular apoptosis. Markers of apoptosis were detected by RT-PCR to confirm the effects of ethanol. BAX and FAS are well-known pro-apoptotic markers, whose expression levels were found to be increased in U87MG, U373MG, GBL-13 and GBL-15 in an ethanol concentration-dependent manner (Fig. 3A, 4A). BCL-2 is a well-known anti-apoptotic marker whose expression level was found to be decreased in every type of cells that were treated with ethanol (Fig. 3A, 4A). Additionally, ethanol-induced apoptosis was checked at protein level using Western Blot Analysis. The expressions of Bcl-2, full length caspase-3 and full length caspase-9 were decreased as the ethanol concentration was increased (Fig. 3B, 4B). In contrast, the expressions of Bax, cleaved caspase-3 and cleaved caspase-9 were increased in in an ethanol dose-dependent manner (Fig. 3B, 4B). In short, it was found that when exposed to 5% ethanol for 24 h, two primary glioblastoma cells and immortalized glioblastoma cell lines exhibited increased expression levels of the pro-apoptotic proteins and decreased expression levels of anti-apoptotic proteins in an ethanol dose-dependent manner. These expression patterns indicate that ethanol treatment caused an apoptotic event in all 4 types of cells tested in our study.
LDH are well known tests for the measurement of membrane integrity and cell toxicity. LDH leakage of primary glioblastoma cells was found to be gradually increased in an ethanol dose-dependent manner (Fig. 2B). LDH leakage of GBL-13 was observed to be gradually increased up to 151 degrees at a concentration of 5% ethanol at 24 h when compared with the control group (no ethanol-treated, LDH leakage level=100). LDH leakage of GBL-15 was also gradually increased up to 136 degrees at 24 h. However, immortalized glioblastoma cell lines showed a different pattern of LDH leakage (Fig. 2B). LDH leakage of U87MG increased only up to 111 degrees at a 5% ethanol concentration at 24 h. And strikingly, LDH leakage of U373MG was slightly reduced to 92 degrees at a 5% ethanol concentration at 24 h. These results suggest that LDH leakage of the primary glioblastoma cells due to ethanol treatment more easily occurred than that of immortalized cell lines.
Ethanol treatments at concentrations of 0%, 1%, and 5% were applied to examine the intracellular reduction system and especially to determine the effects of the nicotinamide nucleotide. Four types of cells were treated with indicated dose of ethanol and were measured for NAD+/NADH ratio (Fig. 5). NAD+/NADH ratio of U87MG was found to be decreased by approximately 14% compared with the control group at a 5% ethanol concentration at 24 h. NAD+/NADH ratio of U373MG was also decreased by roughly 39% compared with the control group at 24 h. In addition, NAD+/NADH ratio of primary glioblastoma cells was decreased by approximately 20% compared with the control group at a 5% ethanol concentration at 24 h. These results indicate that ethanol exposure enhances the intracellular NADH concentration in both primary and immortalized glioblastoma cells.
In order to examine the effect of ethanol-induced cytotoxicity, viabilities of primary and immortalized glioblastoma cells were measured by CCK-8 assay using water-soluble tetrazolium salt called WST-8 (Fig. 6). Ethanol at concentrations of 0%, 0.1%, 0.5%, 1%, 3%, and 5% was treated on two glioblastoma immortalized cell lines (U87MG and U373MG) and two primary glioblastoma cells (GBL-13 and GBL-15) for 24 h, 48 h, and 72 h. Viabilities of U87MG and U373MG were found to be reduced as ethanol concentration was increased. Specifically, viability of U87MG was significantly decreased to 32% at a 5% ethanol treatment at 72 h. In the case of U373MG, the cell viability was apparently decreased to 7% in the same condition. Furthermore, the primary glioblastoma cells showed the exact same patterns as the immortalized cell lines. At 72 h, viability of GBL-15 was dramatically decreased to 28% at a 5% ethanol concentration. And similarly, viability of GBL-13 was found to be decreased to 43% in the same condition as GBL-15. These results clearly show that not only the immortalized cell lines, but also the primary glioblastoma cells were affected by the ethanol treatments at various concentrations.
The cytotoxic effect of ethanol on human brain cells have been known since the 1970s [3,7]. Ethanol is amphipathic. Thus, ethanol can diffuse rapidly through a cell membrane. It had been demonstrated that ethanol exposure to cells can induce cell death due to lipid peroxidative product accumulation and reactive oxygen species (ROS) generation [3,9,10,11,12,13,14].
The results of the Trypan-blue exclusion assay (Fig. 1C), CytoTox-Glo cytotoxicity assay (Fig. 2A) and CCK-8 assay (Fig. 6) showed that ethanol has a cytotoxic effect. The results of RT-PCR and western blot analyses (Figs. 3~4) also demonstrated that ethanol exposure induces apoptosis in glioblastoma cells. Ethanol-induced cytotoxicity measured by the MTT assay showed that, at an ethanol concentration below 3%, viabilities of the immortalized and primary cultured glioblastoma cells were decreased in an ethanol-dose dependent manner (Fig. 1A). However, the level of MTT reduction was observed to be noticeably underestimated or wrongfully increased especially in primary cultured glioblastoma cells at a concentration of 5% ethanol in comparison to the control condition (Fig. 1A). MTT assay results on the toxicity of high concentration of 5% ethanol treatment did not correspond with the results observed under a microscope. This tendency was observed only in primary glioblastoma cells. Based on this observation, we set out to investigate the unreliability of the MTT results that is induced by ethanol in glioblastoma cells.
In this study, we report that the unreliability of a MTT assay in the assessment of ethanol-induced cytotoxicity on primary cultured glioblastoma cells could be due to nonspecific reduction of tetrazolium salts. Thus, we were confronted with the question: Why do only primary glioblastoma cells show different results between the MTT assay and the actual toxicity for ethanol-induced cytotoxicity? A possible answer for this question is presented. We suggest that the different intracellular responses induced by ethanol treatment are the cause for unreliable results of the MTT assay on primary cultured glioblastoma cells.
First, the different intracellular responses of ethanol treatments could possibly be caused by the non-specific reduction of tetrazolium salt due to the increase in the level of NADH, which is mediated during ethanol metabolism (Fig. 5). Ethanol is known as an inducer of oxidative stress, membrane damage and has been shown to display NADH increasing effect on the cell [14]. Several studies suggest that intracellular NADH is the most influential factor in the non-specific reduction of tetrazolium salt in the immortalized and primary glioblastoma cells. Many studies indicate that cellular reduction of MTT is related to intracellular NADH concentration. NADH is a main electron donor in the MTT reduction [18]. Therefore, we conducted experiments to investigate differences in the expression level of NADH between primary glioblastoma cells and immortalized glioblastoma cell lines. We first assumed that there is a difference in the NADH level between primary and immortalized glioblastoma cells and that these differences would provide different, if not opposite, results for non-mitochondrial reductions and the actual cytotoxicity. However, as shown in figure 5, the NADH proportion of the both two primary glioblastoma cells and the two glioblastoma cell lines at 5% ethanol was found to be increased compared to the control. And this result indicates that, whether it is a cell line or a primary cell, a high concentration of ethanol-induced electron carrier (NADH) was observed at a 5% ethanol treatment which was found to be consistent with the actual cytotoxic results obtained from the other assays.
Second hypothesis for the different MTT assay results between primary glioblastoma cells and glioblastoma cell lines is the change of the membrane integrity caused by the ethanol exposure. LDH assay results (Fig. 2B) demonstrate that ethanol definitely affected the integrity of cell membrane of the primary cultured glioblastoma cells in an ethanol concentration-dependent manner. However, the immortalized cell lines appear almost unaffected by ethanol exposure. It is known that the cell size of the patient-derived primary cells is larger than that of the immortalized cell lines. Thus, it is possible that the primary cell would experience more severe membrane damage by ethanol than the immortalized cell lines. Based on this hypothesis and the obtained results, it is supposed that increase in the intracellular concentration of NADH and the nonspecific reduction by ethanol in primary glioblastoma cells is mediated through damaged membrane at a 5% ethanol concentration. Membrane damage caused by ethanol facilitates the entry of substances into and out of the primary glioblastoma cells. In addition to the increase in the electron donor, MTT reduction of nonspecific reactions is also increased. The CCK assay results also support the second hypothesis. WST-8 is referred to as the second generation MTT and is reduced extracellularly. The reduction is most likely by electron transport across the plasma membrane from intracellular NADH to WST-8 via an intermediate electron carrier. Therefore, WST-8 is thought to be less affected by the membrane damage. In this context, the CCK-8 results of ethanol-induced cytotoxicity on glioblastoma cells appear to be consistent with the second hypothesis. Altogether, intracellular material is more accessible due to membrane damage of the primary cells, which happens to be more severe compared to the cell lines. Therefore, the amount of tetrazolium salt reduction is increased in primary cells which eventually results in the erroneous color reaction of the MTT assay.
A Third possibility is the differences in the ethanol metabolic activity between the primary cells and cell lines. Recent studies regarding the functional comparisons of primary cells and cell lines indicate that primary cells highly express fatty acid synthesis pathway and alcohol metabolism pathway in comparison to cell lines. On the other hand, cell lines were observed to be deficient in mitochondria activity in comparison to primary cells [16]. The high activity of ethanol metabolism in the primary cells indicates that the cell membrane is damaged more easily by ethanol which eventually results in the higher concentration of the total NADH than the immortalized cell lines.
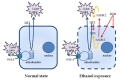
Taken together, our study suggests that MTT assay could provide inaccurate information regarding the assessment of ethanol or cytotoxic drug-induced cytotoxicity on patient-derived primary cultured glioblastoma cells. MTT assay has commonly been used as a classic cytotoxicity test; however, our study demonstrates, based on the proposed model of non-specific reduction of MTT (Fig. 7), that this assay could underestimate the real cytotoxicity by displaying a higher absorbance rather than the actual reduction of the tetrazolium salts from dying cells. As many cytotoxic studies have been and are being conducted using patient-derived primary glioblastoma cells to perform patient-specific research, one needs to carefully interpret the cytotoxic results if obtained from the first generation MTT assay. And it is highly recommended that other cytotoxic assays, such as CCK-8, or clonogenic assay, must be accompanied to produce more reliable and accurate cytotoxic result.
- Mosmann T. Rapid colorimetric assay for cellular growth and survival: application to proliferation and cytotoxicity assays. J Immunol Methods 1983;65:55-63.

- Atterwill CK, Davenport-Jones J, Goonetilleke S, Johnston H, Purcell W, Thomas SM, West M, Williams S. New models for the In vitro assessment of neurotoxicity in the nervous system and the preliminary validation stages of a 'tiered-test' model. Toxicol In Vitro 1993;7:569-580.
- Vistica DT, Skehan P, Scudiero D, Monks A, Pittman A, Boyd MR. Tetrazolium-based assays for cellular viability: a critical examination of selected parameters affecting formazan production. Cancer Res 1991;51:2515-2520.
- Berridge MV, Herst PM, Tan AS. Tetrazolium dyes as tools in cell biology: new insights into their cellular reduction. Biotechnol Annu Rev 2005;11:127-152.
- Berridge MV, Tan AS. Characterization of the cellular reduction of 3-(4,5-dimethylthiazol-2-yl)-2,5-diphenyltetrazolium bromide (MTT): subcellular localization, substrate dependence, and involvement of mitochondrial electron transport in MTT reduction. Arch Biochem Biophys 1993;303:474-482.
- Cookson MR, Mead C, Austwick SM, Pentreath VW. Use of the MTT assay for estimating toxicity in primary astrocyte and C6 glioma cell cultures. Toxicol In Vitro 1995;9:39-48.
- Masters JR. Human cancer cell lines: fact and fantasy. Nat Rev Mol Cell Biol 2000;1:233-236.
- Das SK, Vasudevan DM. Alcohol-induced oxidative stress. Life Sci 2007;81:177-187.
- Higuchi H, Kurose I, Kato S, Miura S, Ishii H. Ethanol-induced apoptosis and oxidative stress in hepatocytes. Alcohol Clin Exp Res 1996;20:340A-346A.
- Cherian PP, Schenker S, Henderson GI. Ethanol-mediated DNA damage and PARP-1 apoptotic responses in cultured fetal cortical neurons. Alcohol Clin Exp Res 2008;32:1884-1892.
- Comporti M, Signorini C, Leoncini S, Gardi C, Ciccoli L, Giardini A, Vecchio D, Arezzini B. Ethanol-induced oxidative stress: basic knowledge. Genes Nutr 2010;5:101-109.
- Bailey SM, Cunningham CC. Acute and chronic ethanol increases reactive oxygen species generation and decreases viability in fresh, isolated rat hepatocytes. Hepatology 1998;28:1318-1326.
- Zhang C, Tian X, Luo Y, Meng X. Ginkgolide B attenuates ethanol-induced neurotoxicity through regulating NADPH oxidases. Toxicology 2011;287:124-130.
- Fadda F, Rossetti ZL. Chronic ethanol consumption: from neuroadaptation to neurodegeneration. Prog Neurobiol 1998;56:385-431.
- Miramar MD, Costantini P, Ravagnan L, Saraiva LM, Haouzi D, Brothers G, Penninger JM, Peleato ML, Kroemer G, Susin SA. NADH oxidase activity of mitochondrial apoptosis-inducing factor. J Biol Chem 2001;276:16391-16398.
- Smiraglia DJ, Rush LJ, Frühwald MC, Dai Z, Held WA, Costello JF, Lang JC, Eng C, Li B, Wright FA, Caligiuri MA, Plass C. Excessive CpG island hypermethylation in cancer cell lines versus primary human malignancies. Hum Mol Genet 2001;10:1413-1419.
- Abe K, Saito H. Amyloid beta protein inhibits cellular MTT reduction not by suppression of mitochondrial succinate dehydrogenase but by acceleration of MTT formazan exocytosis in cultured rat cortical astrocytes. Neurosci Res 1998;31:295-305.
- Berridge MV, Tan AS. Cell-surface NAD(P)H-oxidase: relationship to trans-plasma membrane NADH-oxidoreductase and a potential source of circulating NADH-oxidase. Antioxid Redox Signal 2000;2:277-288.